Problem
I have speed and x,y coordinates of multiple vehicles. To study the behavior of drivers, I want to plot the position of each vehicle using the x and y coordinates that update every 1/60th of a second.
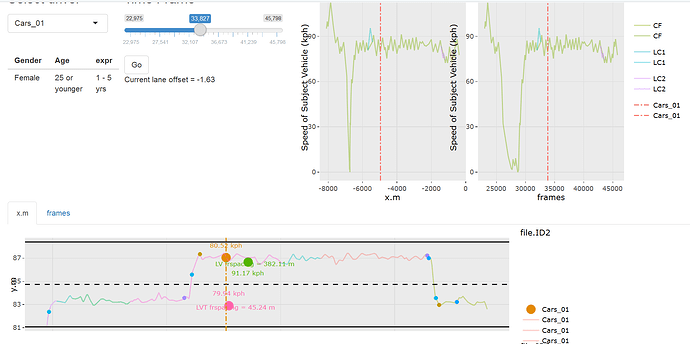
I can do this in shiny by using the sliderInput to change the current time frame that updates the position plot. An example is provided in the following image:
In the image above, the large points and the vertical line move whenever I move the slider. However, since there are thousands of time frames for a given vehicle (as seen in the slider), it is difficult to control the slider to reach a certain location.
Question
Is it possible in ggplot2, plotly and shiny to click and drag one of the large points on the plot over the observed trajectory? This way I'd know where exactly the vehicle was and its speed. If not in R, is there any other plotting option?
1 Like
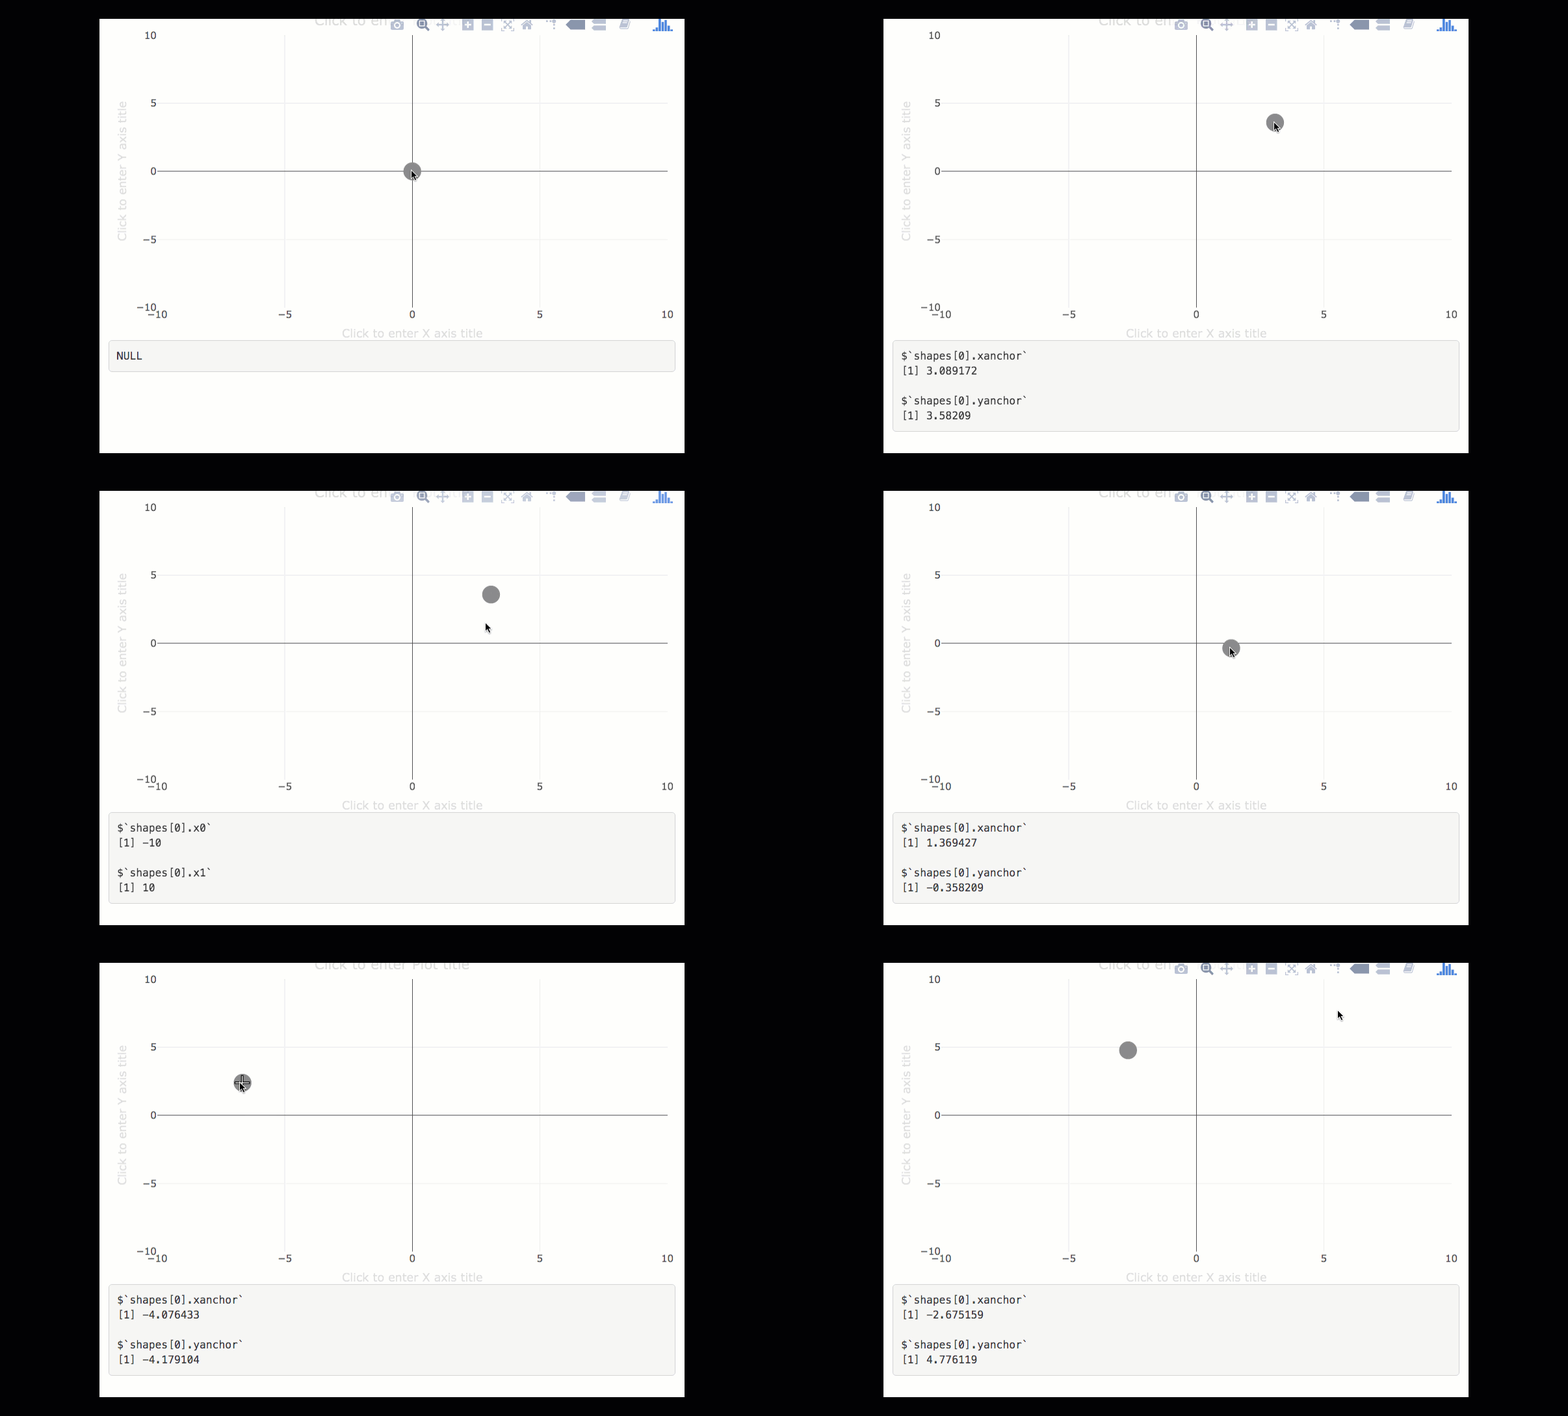
This seems doable. The key is to make your graph 'editable' (i.e., config(p, editable = TRUE)) and use circle shapes, rather than geom_point() (ggplotly() will translate geom_point() to a scatter trace, which you can't drag).
Here is a simple shiny app for rendering a draggable circle shape and outputing the event tied to the "plotly_relayout" event that it triggers.
library(shiny)
library(plotly)

ui <- fluidPage(
  plotlyOutput("p"),
  verbatimTextOutput("event")
)

server <- function(input, output, session) {

  output$p <- renderPlotly({
    plot_ly() %>%
      layout(
        xaxis = list(range = c(-10, 10)),
        yaxis = list(range = c(-10, 10)),
        shapes = list(
          type = "circle",
          fillcolor = "gray",
          line = list(color = "gray"),
          x0 = -1, x1 = 1,
          y0 = -1, y1 = 1,
          xsizemode = "pixel",
          ysizemode = "pixel",
          xanchor = 0, yanchor = 0
        )
      ) %>%
      config(editable = TRUE)

  })

  output$event <- renderPrint({
    event_data("plotly_relayout")
  })

}

shinyApp(ui, server)

3 Likes
This is great, thank you. Is it possible to restrict the movement of the circle to specified x and y coordinates only? Referring to the figure in my original question, I want to drag the circle only along the trajectory so that I get the exact coordinates.
Are you referring to circle resizing that occurs when clicking and dragging on the boundary? I'm not immediately sure if it's possible to disable that...
Sorry, I wasn't referring to the resizing of the circle. I meant that the orange circle, that represents the (x,y) coordinates of a vehicle at a given time on the plot, should not be free to move everywhere on the plot. Rather, it should be restricted to move along the observed (x,y) coordinates only (i.e. the actual journey of the vehicle). The observed coordinates for the whole journey are represented by the trajectory below. It was drawn using geom_path. The x axis = x coordinate and y axis = y coordinate of the center of the vehicle.
Is it possible to restrict the movement of the orange circle only on this trajectory?
Rather, it should be restricted to move along the observed (x,y) coordinates only (i.e. the actual journey of the vehicle).
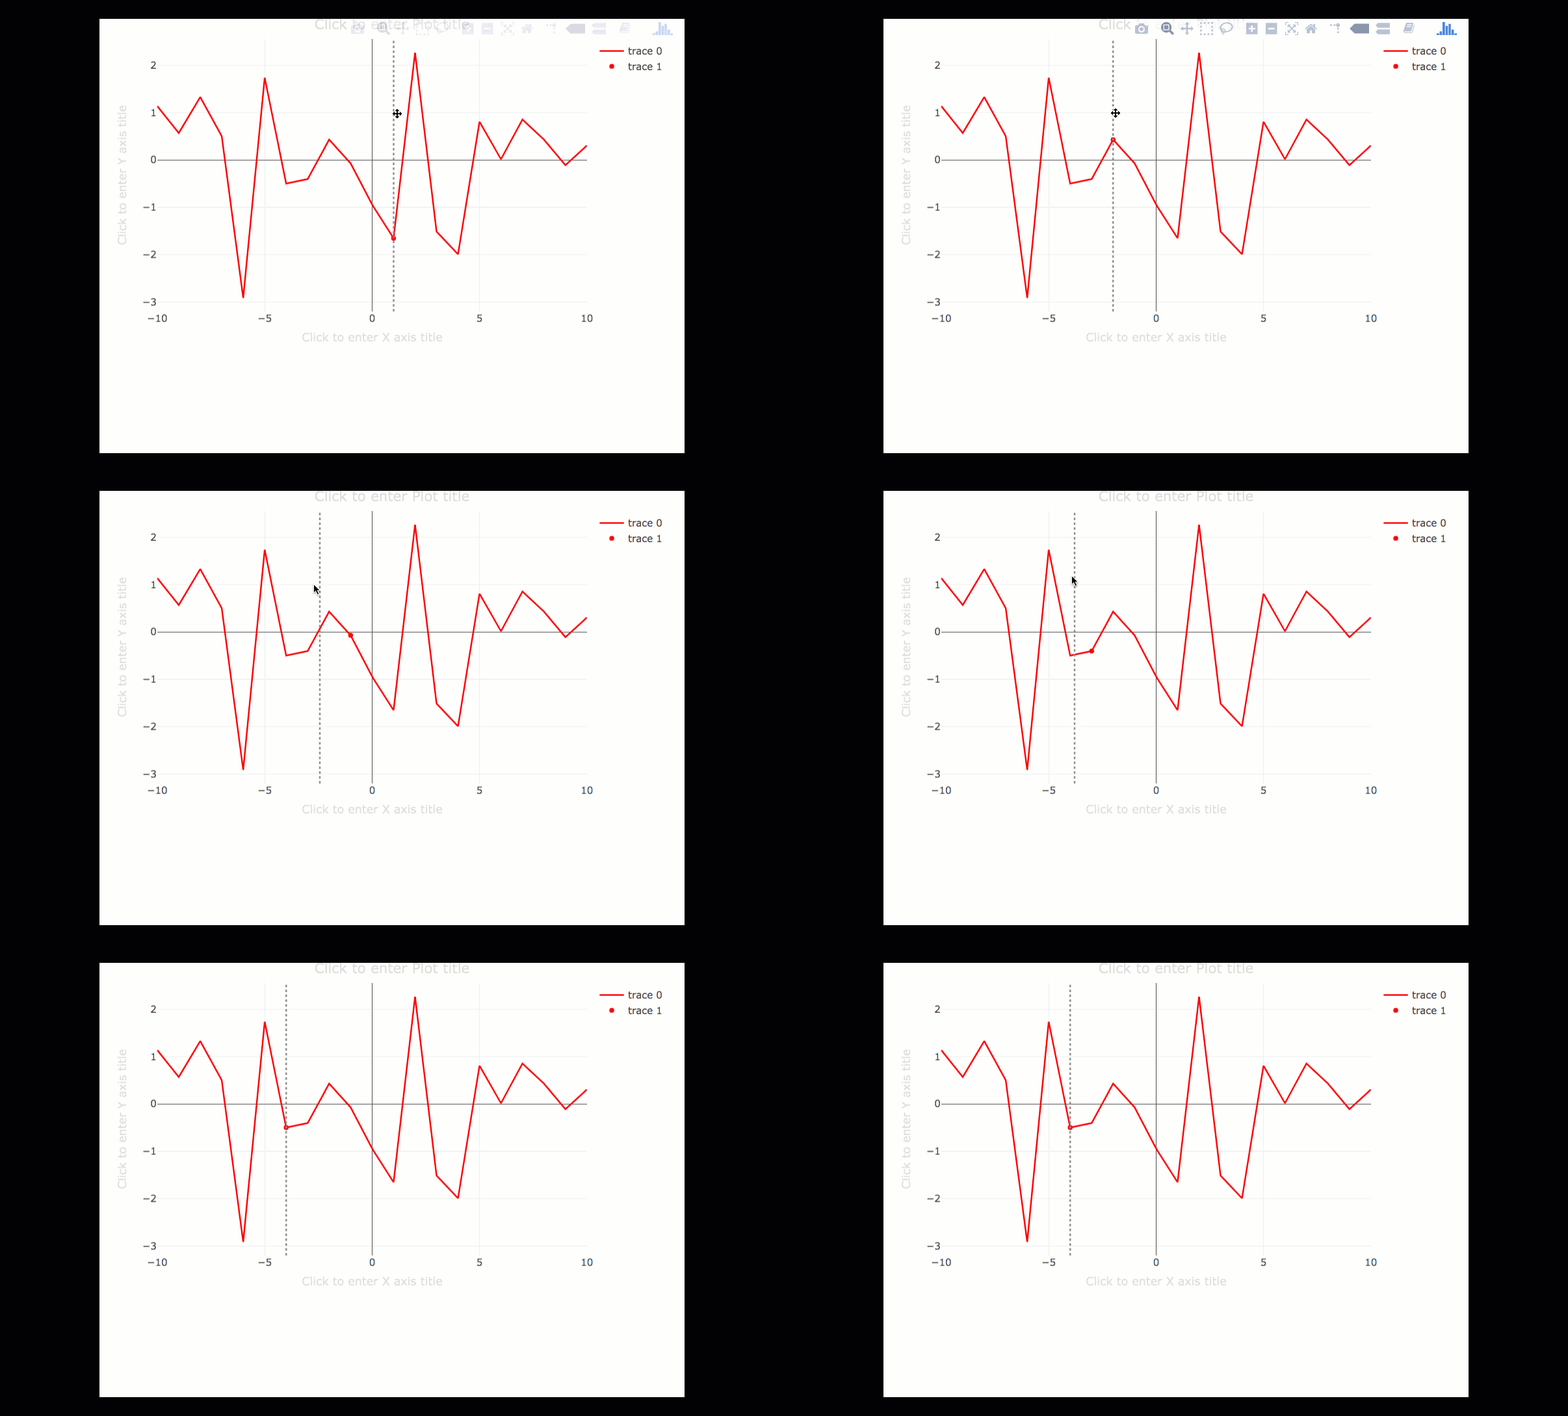
I don't think that will be possible. Instead, what I would do, is have a draggable (vertical) line shape to effectively condition on an x-value. You could also then have a marker place at the corresponding observed (x.y) and have that marker respond to the line dragging.
1 Like
Thanks for your reply. If I understood you correctly, you're suggesting to use a slider to move a vertical line over the plot.
That is exactly what my current solution is. If you see the figure in the question, there is a slider at the top. This slider controls the time frames (1 frame = 1/60 seconds). The (x,y) coordinates are updated based on the observed location of the vehicle at a given time frame. My main issue with the current setup is that I have to move the slider and then check the new location of vehicle on plot. If I want to reach a certain location on the plot, I have to keep moving the slider until the point lands the desired location. So, it would've been nice if I could just click and drag the point, rather than moving slider.
I think this might be only possible in d3.js. Thank you for your help.
I welcome other suggestions from you and the community.
This is what I'm suggesting:
library(shiny)
library(plotly)

ui <- fluidPage(
  plotlyOutput("p"),
  verbatimTextOutput("event")
)

x <- seq(-10, 10)
y <- rnorm(length(x))


server <- function(input, output, session) {

  output$p <- renderPlotly({

    d <- event_data("plotly_relayout", source = "trajectory")

    selected_point <- if (!is.null(d[["shapes[0].x0"]])) {
      xint <- d[["shapes[0].x0"]]
      xpt <- x[which.min(abs(x - xint))]
      list(x = xpt, y = y[which(x == xpt)])
    } else {
      list(x = 1, y = y[which(x == 1)])
    }

    plot_ly(color = I("red"), source = "trajectory") %>%
      add_lines(x = x, y = y) %>%
      add_markers(x = selected_point$x, y = selected_point$y) %>%
      layout(
        shapes = list(
          type = "line",
          line = list(color = "gray", dash = "dot"),
          x0 = selected_point$x,
          x1 = selected_point$x,
          y0 = 0,
          y1 = 1,
          yref = "paper"
        )
      ) %>%
      config(editable = TRUE)
  })

}

shinyApp(ui, server)

8 Likes


