Hi there,
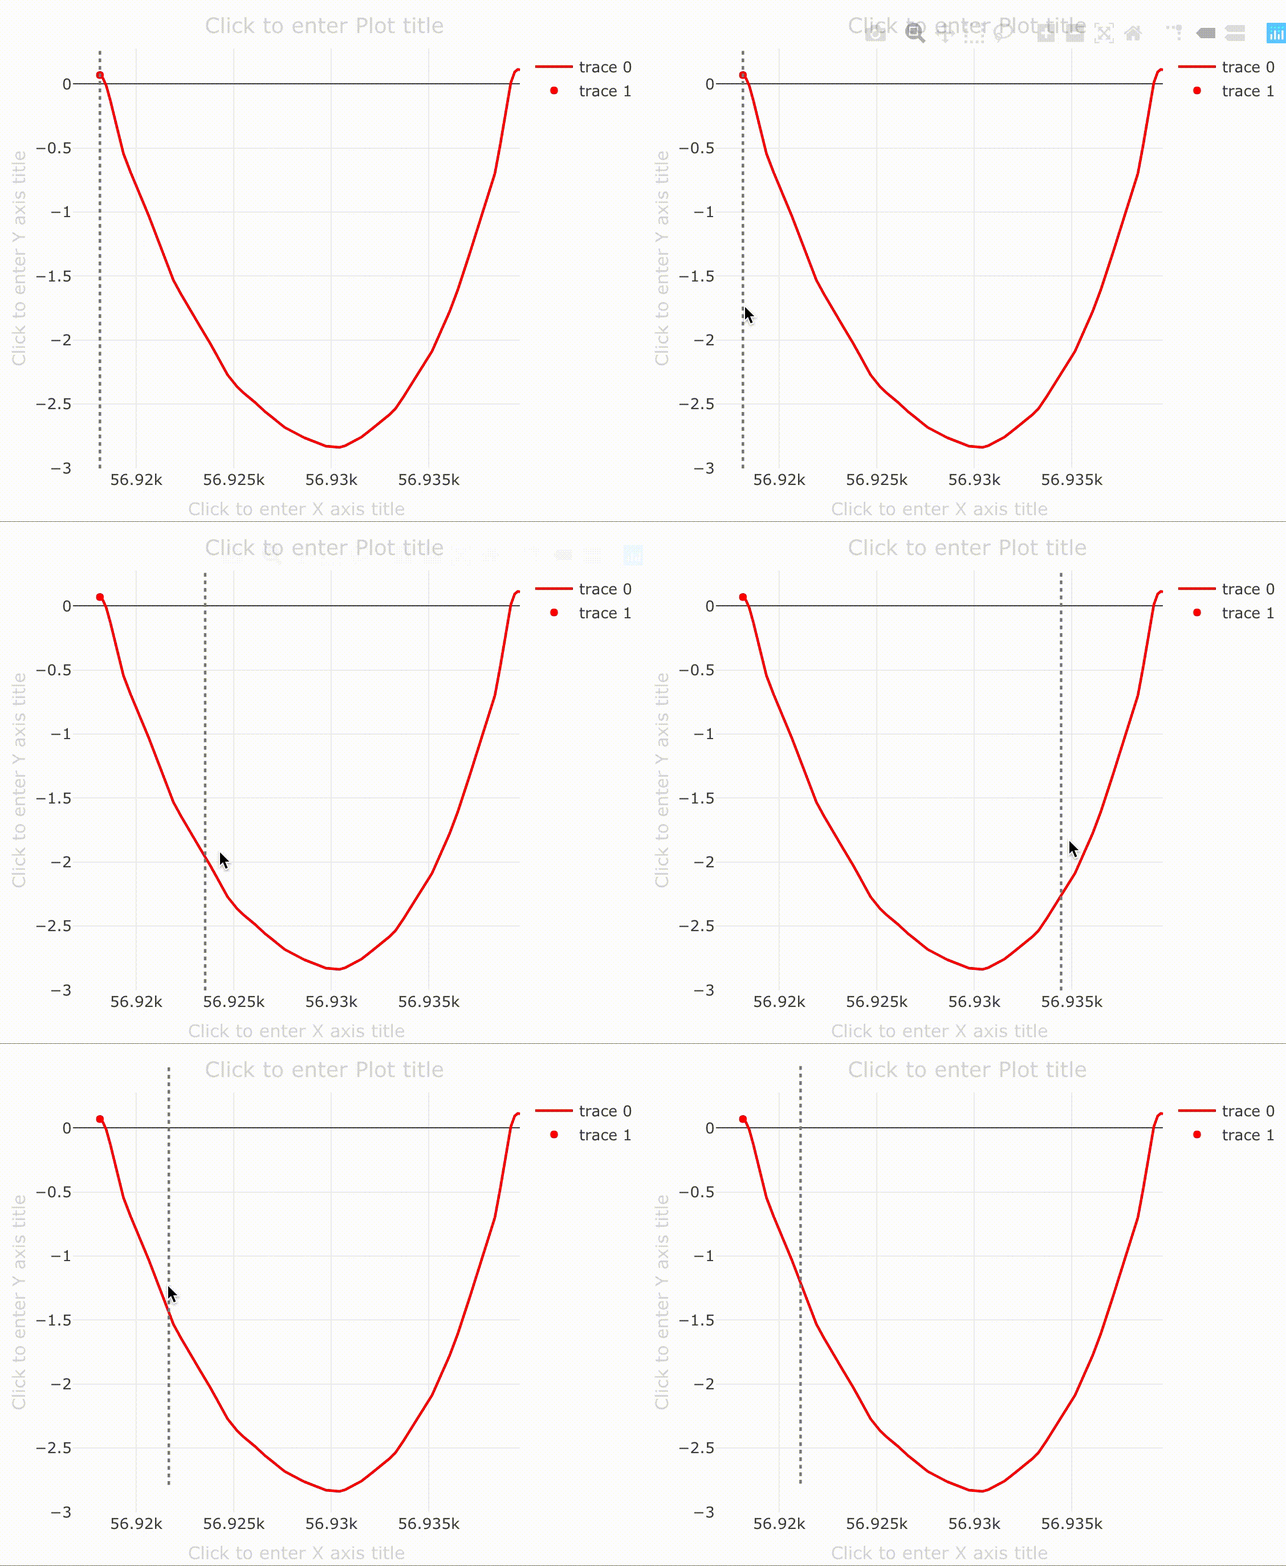
So I was reading this post, linked here and I was able to make my plot with a moveable vertical line! However, when I move the vertical line, the new point where the vertical line and my plot intercept does not update.
I've attached a GIF showing what happens when I move the vertical line.

Also, here is the code that I used, and I had to make some slight modifications to what was originally done in the first post in order for the code to run. Perhaps my changes have caused some issues, but this is the only way that I was able to produce a vertical bar correctly. Also, I put it inside of an eventReactive, because I only want the plot to appear once a button is pressed. Moreover, when the actionButton is pressed again, a new plot is generated. I think I am missing something here, because every time I generate a new plot, after moving the vertical bar, I get an error saying "Error: object 'x' not found".
ui <- fluidPage(
plotlyOutput("new_plot")
)

server <- function(input, output, session) {
 s <- eventReactive(c(input$submit, input$GO), {
       rv <- reactiveValues(x = NULL, y = NULL)

       rv$x <- as.vector(time.local)
       rv$y <- as.vector(depth)

       d <- event_data("plotly_relayout", source = "trajectory")

        selected_point <- if (!is.null(d[["shapes[0].x0"]])) {
            xint <- d[["shapes[0].x0"]]
            xpt <- rv$x[which.min(abs(rv$x - xint))]
            list(x = xpt, y = rv$y[which(x == xpt)])
        } else {
            list(x = min(rv$x), y = rv$y[which(rv$x == min(rv$x))])
        }

        plot_ly(color = I("red"), source = "trajectory") %>%
            add_lines(x = rv$x, y = rv$y) %>%
            add_markers(x = selected_point$x, y = selected_point$y) %>%
            layout(
                shapes = list(
                    type = "line",
                    line = list(color = "gray", dash = "dot"),
                    x0 = selected_point$x,
                    x1 = selected_point$x,
                    y0 = 0,
                    y1 = 1,
                    yref = "paper"
                )
            ) %>%
            config(editable = TRUE)
}

  output$new_plot <- renderPlotly({
       s()
    })
}

shinyApp(ui = ui, server = server)
Any help with these issues would be greatly appreciated. I'd be happy to provide any additional information that you might need!