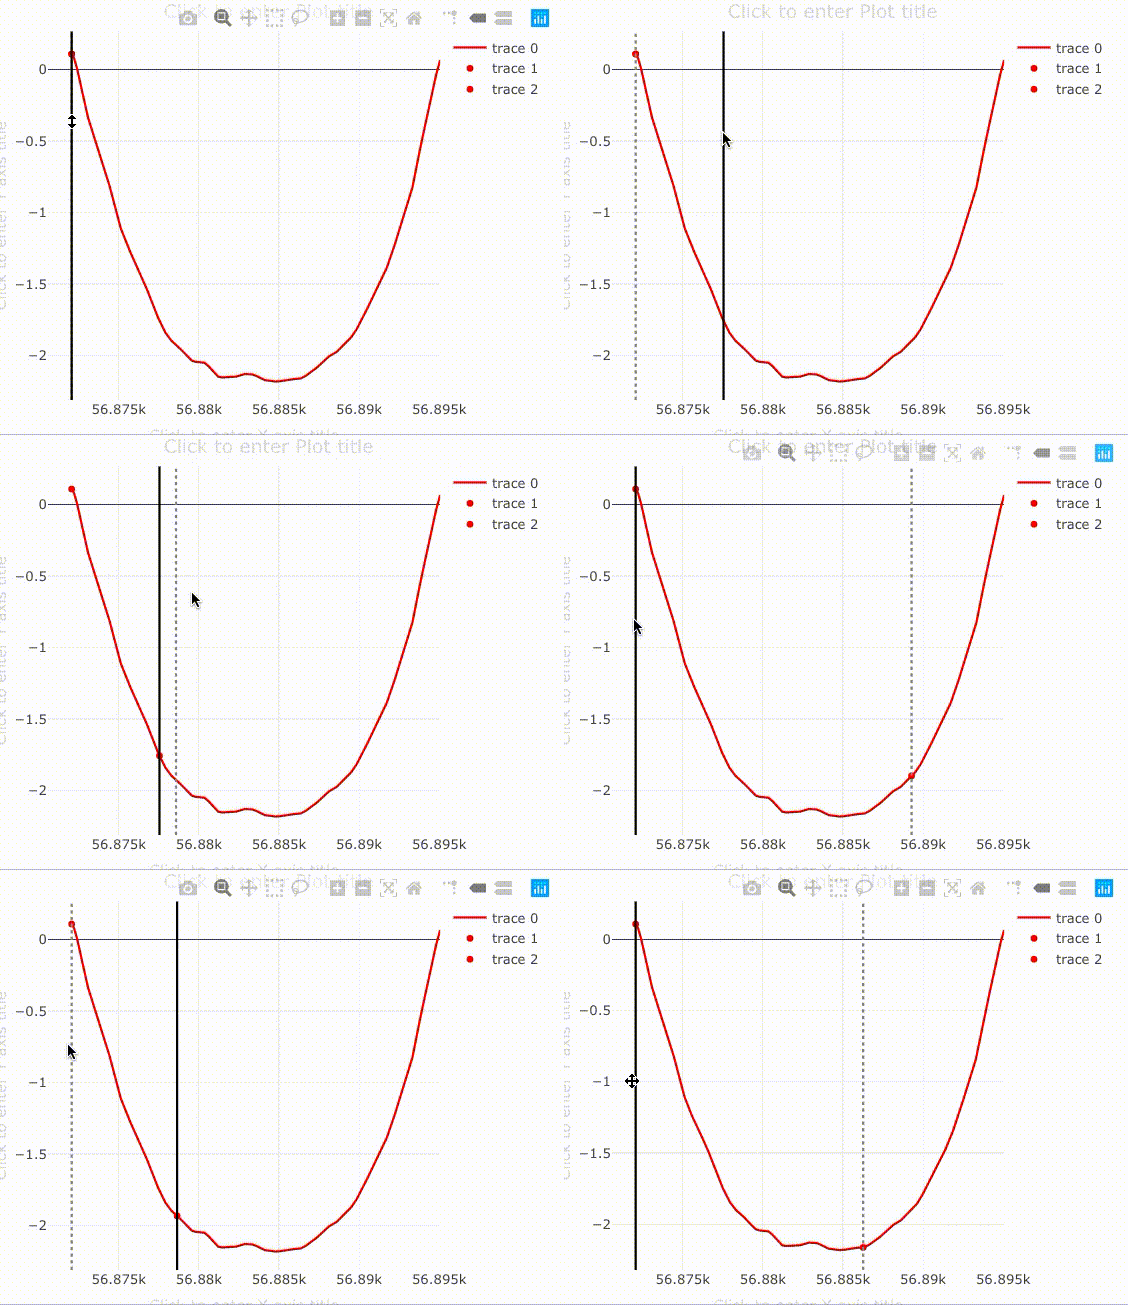
So, I've been working on a project that involves having moveable lines on my plot in Shiny. I've followed the answers given here and it worked really great! Then, I needed to make some modifications which happened here. So far, so good. However, my issue now is that I am trying to add a second moveable line onto this plot, and it's really not working out. Every time I move the second line, the first one reverts back to its original position. I have a feeling this is because !is.null(d[["shape[0].x0"]]) is evaluating to be FALSE, making the line go back to the minimum x value. Perhaps I've done something wrong here, especially since I'm quite new with Shiny. You can see a GIF attached which demonstrates the issue:

Here is my code, with the data modified so that it can be reproduced.
I think my issue is in the selected_point variable. I am trying to create two points, (x,y) and (x2,y2) so that I can "save" both intersections of the vertical lines with the curve in red. However, I feel like I am doing something wrong here. The problem could also be in the plot_ly function and how I am implementing the vertical lines, but I'm really not sure. Any help, hints, or tips would be much appreciated!
server <- function(input, output, session) {

    rv <- reactiveValues(x = NULL, y = NULL, x2 = NULL, y2 = NULL)

    s <- reactive({
        rv$x <- c(-100:100)
        rv$y <- c(-100:100)**2

        rv$x2 <- c(-100:100)
        rv$y2 <- c(-100:100)**2

        d <- event_data("plotly_relayout", source = "trajectory")

        selected_point <- if (!is.null(d[["shapes[0].x0"]])) {
            xint <- d[["shapes[0].x0"]]
            xpt <- rv$x[which.min(abs(rv$x - xint))]
            rv$save_x <- xpt
            if (!is.null(d[["shapes[1].x0"]])) {
                xint2 <- d[["shapes[1].x0"]]
                xpt2 <- rv$x[which.min(abs(rv$x - xint2))]
                rv$save_x2 <- xpt2
                list(x = xpt, y = rv$y[which.min(abs(rv$x - xint))],
                     x2 = xpt2, y2 = rv$y[which.min(abs(rv$x - xint2))])
            }
            else {
                list(x = xpt, y = rv$y[which.min(abs(rv$x - xint))],
                            x2 = min(rv$x), y2 = rv$y[which(rv$x == min(rv$x))])
            }
        } else {
            if (!is.null(d[["shapes[1].x0"]])) {
                xint2 <- d[["shapes[1].x0"]]
                xpt2 <- rv$x[which.min(abs(rv$x - xint2))]
                rv$save_x2 <- xpt2
                list(x = min(rv$x), y = rv$y[which(rv$x == min(rv$x))],
                            x2 = xpt2, y2 = rv$y[which.min(abs(rv$x - xint2))])
            }
            else{
                list(x = min(rv$x), y = rv$y[which(rv$x == min(rv$x))],
                            x2 = min(rv$x), y2 = rv$y[which(rv$x == min(rv$x))])
            }
        }
        plot_ly(color = I("red"), source = "trajectory") %>%
            add_lines(x = rv$x, y = rv$y) %>%
            add_markers(x = selected_point$x, y = selected_point$y) %>%
            add_markers(x = selected_point$x2, y = selected_point$y2) %>%
            layout(shapes = list(
                list(
                    type = "line",
                    line = list(color = "gray", dash = "dot"),
                    x0 = selected_point$x,
                    x1 = selected_point$x,
                    y0 = 0,
                    y1 = 1,
                    yref = "paper"),
                list(
                    type = "line",
                    line = list(color = "black", dash = "solid"),
                    x0 = selected_point$x2,
                    x1 = selected_point$x2,
                    y0 = 0,
                    y1 = 1,
                    yref = "paper")
            )) %>%
            config(editable = TRUE)
       })
      output$new_plot <- renderPlotly({
           s()
       })
})

ui <- fluidPage(
plotlyOutput("new_plot")
)