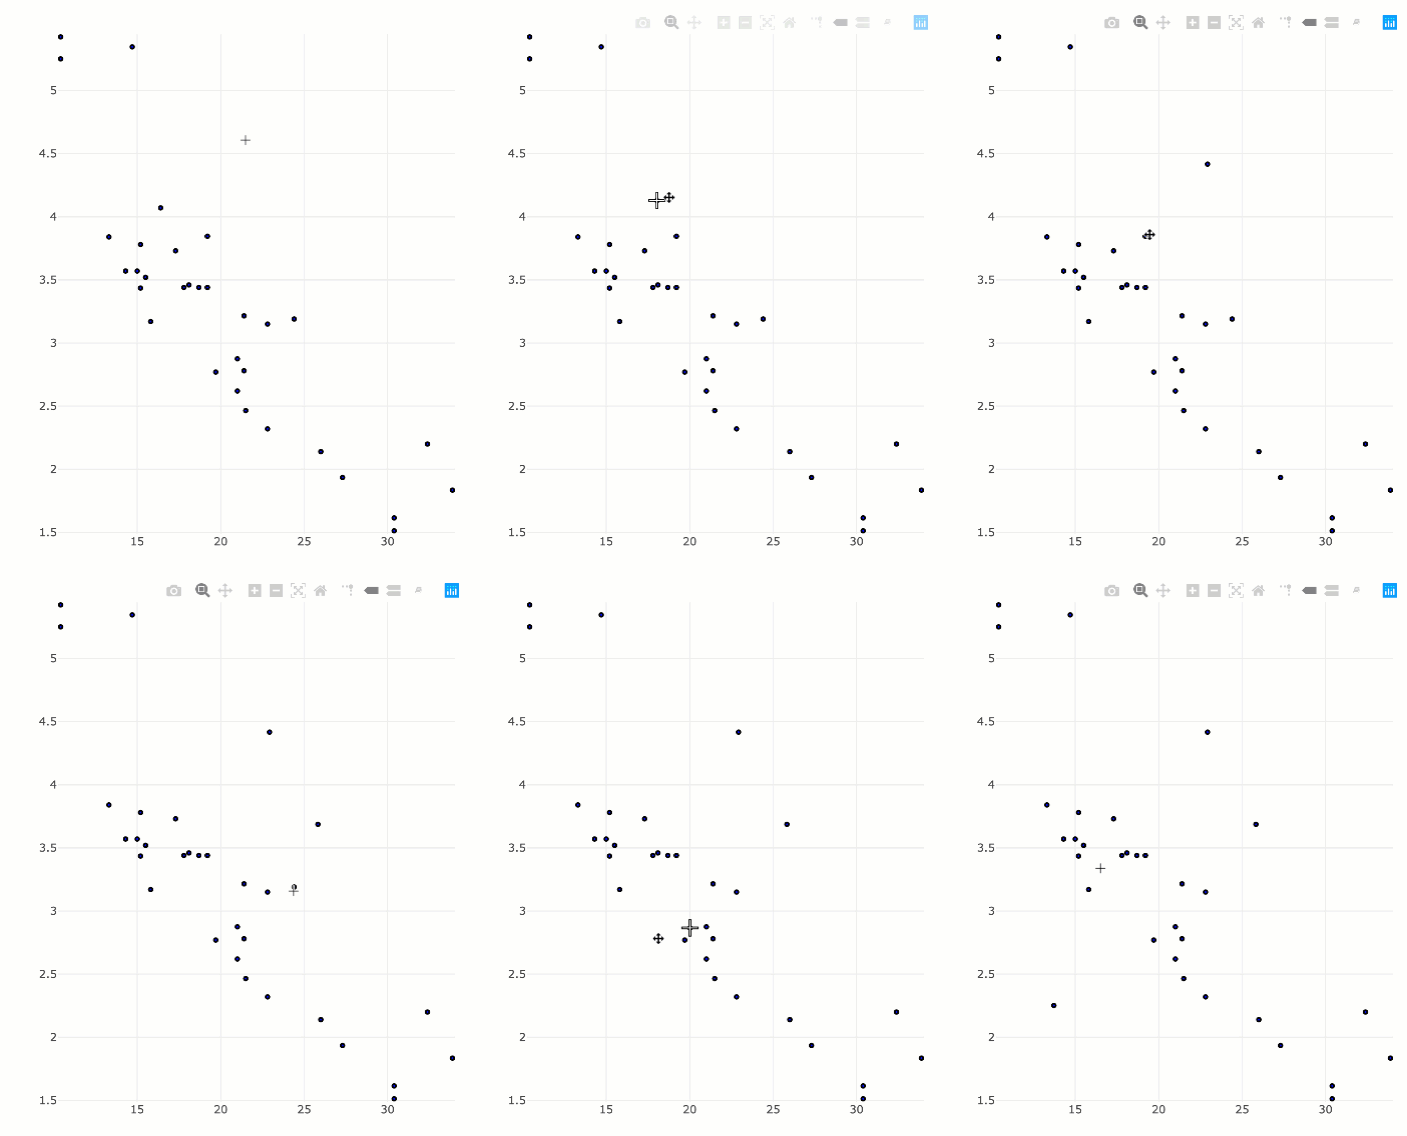
Hi, can you help me draggging multiple points using plotly. I saw the points was single movable point. Thanks
Sure, you'll need to pass multiple circle shapes to the layout(), then use config() to make them editable. The hard part is understanding how to create a suitable list of circles -- these are a special case of plotly.js shapes that are documented here -- Single-page reference in R
library(plotly)
library(purrr)

# creates a list of 32 circle shapes (one for each row/car)
circles <- map2(
  mtcars$mpg,
  mtcars$wt,
  ~list(
    type = "circle",
    # anchor circles at (mpg, wt)
    xanchor = .x,
    yanchor = .y,
    # give each circle a 2 pixel diameter
    x0 = -2, x1 = 2,
    y0 = -2, y1 = 2,
    xsizemode = "pixel",
    ysizemode = "pixel",
    # other visual properties
    fillcolor = "blue",
    line = list(color = "transparent")
  )
)

plot_ly() %>%
  layout(shapes = circles) %>%
  config(edits = list(shapePosition = TRUE))

Thanks a lot. Also, can you kindly suggest as to how we can change the size of the circles, based on another column values. For Example - the size of the circle would depend on the mtcars$qsec. Thanks !.
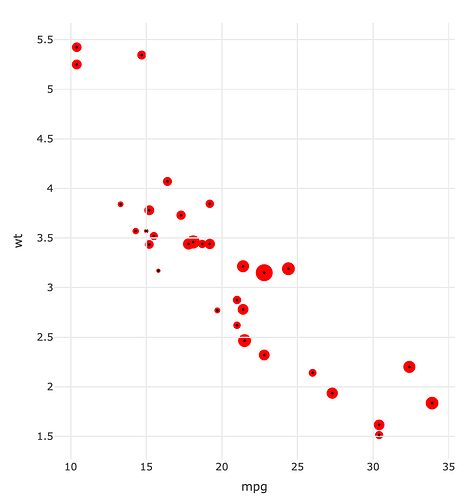
You're welcome, here's how I would do it:
library(plotly)
library(purrr)
library(dplyr)

# map qsec to circle area (between 5 to 20 pixels)
mtcars <- mtcars %>%
  mutate(size = scales::rescale(sqrt(qsec), to = c(5, 20)))

# creates a list of 32 circle shapes (one for each row/car)
circles <- pmap(
  mtcars[c("mpg", "wt", "size")],
  function(mpg, wt, size) {
    list(
      type = "circle",
      xanchor = mpg,
      yanchor = wt,
      x0 = -size/2,
      y0 = -size/2,
      x1 = size/2,
      y1 = size/2,
      xsizemode = "pixel",
      ysizemode = "pixel",
      # other visual properties
      fillcolor = "red",
      line = list(color = "transparent"),
      layer = "below"
    )
  }
)

plot_ly(mtcars, color = I("black")) %>%
  add_markers(x = ~mpg, y = ~wt, text = ~qsec, marker = list(size = 3)) %>%
  layout(shapes = circles) %>%
  config(edits = list(shapePosition = TRUE))
Hi cpsievert
I just updated my plotly package and now its working fine. Thanks a lot.
Wanted to check a few things and it will be great if you can help -
- Can we remove that black color dot that is representing the points
- Change the color of the points based on different brand
- When we move the points, can the value for that particular point be updated to the new value
I know i am asking a lot of questions, sorry for that. You have been of immense help and i am learning a lot from you.
If you also share some documentation from where i can learn and accomplish the above tasks it will be helpful for me.
Much Thanks. Deeply Grateful to you !
This topic was automatically closed 7 days after the last reply. New replies are no longer allowed.
If you have a query related to it or one of the replies, start a new topic and refer back with a link.
-
If you don't want the black dots, you can remove the
add_markers()layer. -
To change the color, change
fillcolor. -
Here's an example of accessing/responding to the new values in shiny https://plotly-r.com/linking-views-with-shiny.html#fig:shiny-edit-annotations
