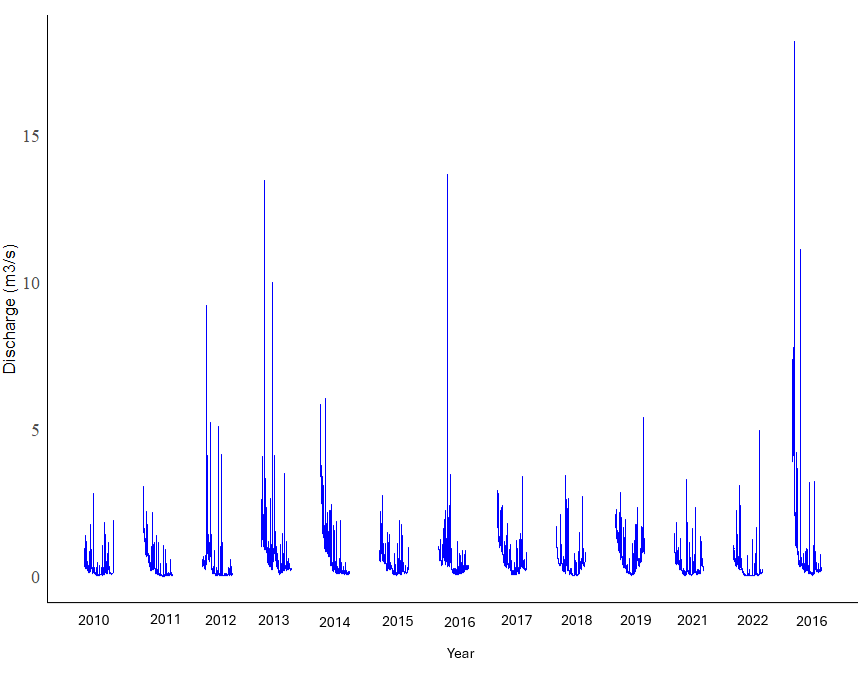
Hi, I plotted a graph with stream discharge data from May 31 to October 31 of each year from 2010 until 2022, but cannot get the years displayed properly on the horizontal axis.
Below is the code that I used to create my graph
# Read the data
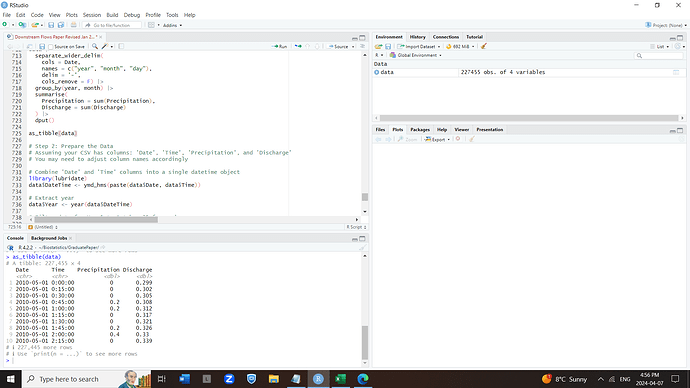
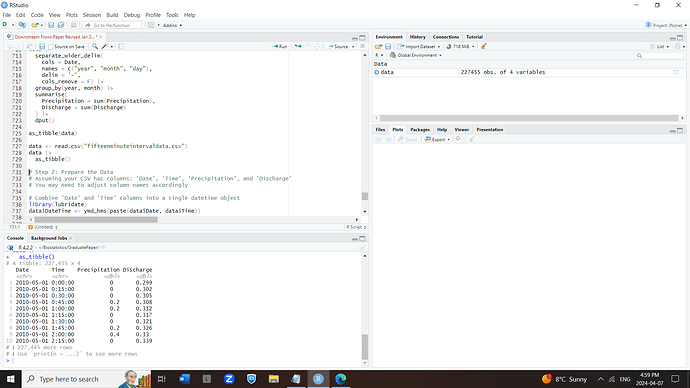
data <- read.csv("fifteenminuteintervaldata.csv")
data

# Combine 'Date' and 'Time' columns into a single datetime object
library(lubridate)
data$DateTime <- ymd_hms(paste(data$Date, data$Time))

# Troubleshoot the Warning message "1 failed to parse"
# Combine 'Date' and 'Time' columns into a single datetime object
library(lubridate)
combined_datetime <- paste(data$Date, data$Time)
parsed_datetime <- ymd_hms(combined_datetime, quiet = TRUE)

# Identify rows with failed parsing
failed_rows <- which(is.na(parsed_datetime))
failed_rows # row 24958 failed to parse
  # Remove row 24958 from the dataset
data <- subset(data, !(row.names(data) == "24958"))

# Remove rows with missing discharge values
data <- data[!is.na(data$Discharge), ]

# Combine 'Date' and 'Time' columns into a single datetime object
library(lubridate)
data$DateTime <- ymd_hms(paste(data$Date, data$Time))
data # view the combined "DateTime" column

# Extract the year, as do not want to have data from October 31 of previous year connected with data from May 1 of next year
data$Year <- year(data$DateTime)

# Step 1: Load the Data
data <- read.csv("fifteenminuteintervaldata.csv")

# Step 2: Prepare the Data
# Assuming your CSV has columns: 'Date', 'Time', 'Precipitation', and 'Discharge'
# You may need to adjust column names accordingly

# Combine 'Date' and 'Time' columns into a single datetime object
library(lubridate)
data$DateTime <- ymd_hms(paste(data$Date, data$Time))

# Extract year
data$Year <- year(data$DateTime)

# Filter data for May 1 to October 31 for each year
filtered_data <- lapply(unique(data$Year), function(year) {
  subset(data, Year == year & month(DateTime) >= 5 & month(DateTime) <= 10)
})

# Step 3: Plotting
library(ggplot2)

# Create the plot using ggplot2
plot <- ggplot() +
  labs(x = "Year",
       y = "Discharge (m3/s)") +
  theme_minimal() +  # Remove grey background
  theme(axis.text = element_text(family = "Times New Roman", size = 12),  # Change font to Times New Roman and increase size
        panel.grid.major = element_blank(),  # Remove major gridlines
        panel.grid.minor = element_blank(),  # Remove minor gridlines
        axis.line = element_line(color = "black")) +  # Add lines for horizontal and vertical axis
  scale_x_continuous(breaks = seq(2010, 2022, by = 1),  # Set breaks for x-axis from 2010 to 2022
                     labels = c("2010", "2011", "2012", "2013", "2014", "2015", "2016", "2017", "2018", "2019", "2020", "2021", "2022"))  # Set labels for x-axis

# Add line segments for each year
for (i in 1:length(filtered_data)) {
  plot <- plot + geom_segment(data = filtered_data[[i]],
                              aes(x = DateTime, xend = lead(DateTime),
                                  y = Discharge, yend = lead(Discharge)),
                              color = "blue")
}

# Hide the title
plot <- plot + theme(plot.title = element_blank()) + scale_x_continuous(breaks = seq(2010, 2022, by = 1),  # Set breaks for x-axis from 2010 to 2022
labels = c("2010", "2011", "2012", "2013", "2014", "2015", "2016", "2017", "2018", "2019", "2020", "2021", "2022"))  # Set labels for x-axis

# Show the plot
print(plot)
The above code produced the following plot:
As shown above, there are no labels on the horizontal axis. There are 13 clusters of lines in this graph. I want the labels "2010", "2011", "2012", "2013", "2014", "2015", 2016", "2017", "2018", "2019" and "2020" under each cluster. I also want to change the font on the plot to Times New Roman. Does anyone have any advice?
TIA


