Thank you. When I followed @jrkrideau's code I got the same output. Below is my output when I type dput(head(data,100)).
dput(head(data, 100))
structure(list(Date = c("2010-05-01", "2010-05-01", "2010-05-01",
"2010-05-01", "2010-05-01", "2010-05-01", "2010-05-01", "2010-05-01",
"2010-05-01", "2010-05-01", "2010-05-01", "2010-05-01", "2010-05-01",
"2010-05-01", "2010-05-01", "2010-05-01", "2010-05-01", "2010-05-01",
"2010-05-01", "2010-05-01", "2010-05-01", "2010-05-01", "2010-05-01",
"2010-05-01", "2010-05-01", "2010-05-01", "2010-05-01", "2010-05-01",
"2010-05-01", "2010-05-01", "2010-05-01", "2010-05-01", "2010-05-01",
"2010-05-01", "2010-05-01", "2010-05-01", "2010-05-01", "2010-05-01",
"2010-05-01", "2010-05-01", "2010-05-01", "2010-05-01", "2010-05-01",
"2010-05-01", "2010-05-01", "2010-05-01", "2010-05-01", "2010-05-01",
"2010-05-01", "2010-05-01", "2010-05-01", "2010-05-01", "2010-05-01",
"2010-05-01", "2010-05-01", "2010-05-01", "2010-05-01", "2010-05-01",
"2010-05-01", "2010-05-01", "2010-05-01", "2010-05-01", "2010-05-01",
"2010-05-01", "2010-05-01", "2010-05-01", "2010-05-01", "2010-05-01",
"2010-05-01", "2010-05-01", "2010-05-01", "2010-05-01", "2010-05-01",
"2010-05-01", "2010-05-01", "2010-05-01", "2010-05-01", "2010-05-01",
"2010-05-01", "2010-05-01", "2010-05-01", "2010-05-01", "2010-05-01",
"2010-05-01", "2010-05-01", "2010-05-01", "2010-05-01", "2010-05-01",
"2010-05-01", "2010-05-01", "2010-05-01", "2010-05-01", "2010-05-01",
"2010-05-01", "2010-05-01", "2010-05-01", "2010-05-02", "2010-05-02",
"2010-05-02", "2010-05-02"), Time = c("0:00:00", "0:15:00", "0:30:00",
"0:45:00", "1:00:00", "1:15:00", "1:30:00", "1:45:00", "2:00:00",
"2:15:00", "2:30:00", "2:45:00", "3:00:00", "3:15:00", "3:30:00",
"3:45:00", "4:00:00", "4:15:00", "4:30:00", "4:45:00", "5:00:00",
"5:15:00", "5:30:00", "5:45:00", "6:00:00", "6:15:00", "6:30:00",
"6:45:00", "7:00:00", "7:15:00", "7:30:00", "7:45:00", "8:00:00",
"8:15:00", "8:30:00", "8:45:00", "9:00:00", "9:15:00", "9:30:00",
"9:45:00", "10:00:00", "10:15:00", "10:30:00", "10:45:00", "11:00:00",
"11:15:00", "11:30:00", "11:45:00", "12:00:00", "12:15:00", "12:30:00",
"12:45:00", "13:00:00", "13:15:00", "13:30:00", "13:45:00", "14:00:00",
"14:15:00", "14:30:00", "14:45:00", "15:00:00", "15:15:00", "15:30:00",
"15:45:00", "16:00:00", "16:15:00", "16:30:00", "16:45:00", "17:00:00",
"17:15:00", "17:30:00", "17:45:00", "18:00:00", "18:15:00", "18:30:00",
"18:45:00", "19:00:00", "19:15:00", "19:30:00", "19:45:00", "20:00:00",
"20:15:00", "20:30:00", "20:45:00", "21:00:00", "21:15:00", "21:30:00",
"21:45:00", "22:00:00", "22:15:00", "22:30:00", "22:45:00", "23:00:00",
"23:15:00", "23:30:00", "23:45:00", "0:00:00", "0:15:00", "0:30:00",
"0:45:00"), Precipitation = c(0, 0, 0, 0.2, 0.2, 0, 0, 0.2, 0.4,
0, 0, 0.2, 0, 0, 0, 0, 0.2, 0, 0, 0.6, 0.4, 0.2, 0, 0, 0, 0,
0, 0, 0, 0, 0.2, 0, 0, 0, 0, 0, 0, 0, 0, 0, 0, 0, 0, 0, 0, 0,
0, 0, 0, 0, 0, 0, 0, 0, 0, 0, 0, 0, 0, 0, 0, 0, 0, 0, 0, 0, 0,
0, 0, 0, 0, 0, 0, 0, 0, 0, 0, 0, 0, 0, 0, 0, 0, 0, 0, 0, 0, 0,
0, 0, 0, 0, 0, 0, 0, 0, 0, 0, 3, 0), Discharge = c(0.299, 0.302,
0.305, 0.308, 0.312, 0.317, 0.321, 0.326, 0.33, 0.339, 0.352,
0.38, 0.41, 0.428, 0.424, 0.419, 0.415, 0.41, 0.411, 0.412, 0.414,
0.415, 0.416, 0.44, 0.459, 0.465, 0.495, 0.495, 0.495, 0.495,
0.495, 0.495, 0.471, 0.453, 0.44, 0.431, 0.422, 0.423, 0.423,
0.424, 0.424, 0.425, 0.425, 0.426, 0.427, 0.427, 0.428, 0.428,
0.429, 0.429, 0.43, 0.43, 0.431, 0.431, 0.432, 0.432, 0.433,
0.433, 0.434, 0.434, 0.435, 0.441, 0.471, 0.527, 0.565, 0.562,
0.559, 0.556, 0.552, 0.665, 0.892, 0.941, 0.937, 0.933, 0.928,
0.924, 0.843, 0.812, 0.765, 0.729, 0.693, 0.672, 0.644, 0.617,
0.611, 0.591, 0.578, 0.569, 0.559, 0.55, 0.54, 0.538, 0.536,
0.534, 0.532, 0.53, 0.528, 0.526, 0.524, 0.521)), row.names = c(NA,
100L), class = "data.frame")
How do I use this to create plots for the relationships between the precipitation depth (mm), precipitation intensity (mm/hr) and increase in stream discharge (m3/s)?
When I try to plot this using the code
# Read the data
mydata <- read.csv("fifteenminuteintervaldata.csv")
mydata # 15 minute interval precipitation and discharge data from 2010 to 2022

# redirect console output to the new file, "data_for_posit.txt"
sink("data_for_posit.txt")

# print contents of first 100 rows to file
dput(head(mydata, 100))

# redirect output back to console (very important!)
sink()

# Combine date and time columns into a single datetime column
mydata$DateTime <- as.POSIXct(paste(mydata$Date, mydata$Time), format="%Y-%m-%d %H:%M:%S")
mydata <- mydata[, !(names(mydata) %in% c("Date", "Time"))]

# Calculate precipitation intensity (precipitation depth divided by time interval)
mydata$Precipitation_intensity <- mydata$Precipitation / (15 * 60)  # Convert 15 minutes to seconds

#Calculate the increase in discharge, you can calculate it by taking the difference between consecutive discharge values
mydata$Increase_in_discharge <- c(NA, diff(mydata$Discharge))

# Plot the correlation between precipitation depth, precipitation intensity, and increase in discharge
library(ggplot2)
ggplot(mydata, aes(x = Precipitation, y = Increase_in_discharge, color = Precipitation_intensity)) +
  geom_point() +
  labs(x = "Precipitation Depth (mm)", y = "Increase in Discharge (m3/s)", color = "Precipitation Intensity (mm/hr)") +
  theme_minimal()
I get the following plot:
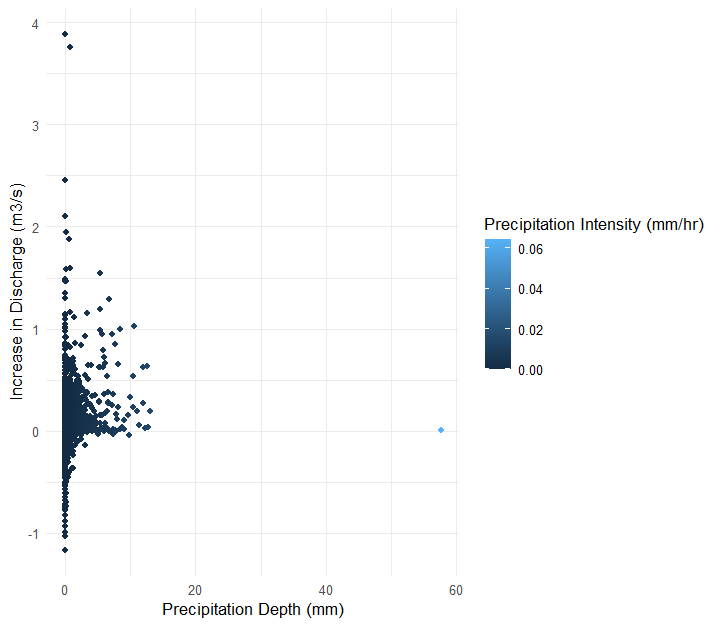
Clearly there are some obvious issues in this plot:
- Nearly all of the precipitation intensities are less than 0.06 mm/hr
- I cannot have a negative increase in discharge
- Most rainfall events have precipitation intensities greater than 0.06 mm/hr, which aren't even shown on the graph.
I think that I have both done something wrong when calculating the rainfall intensities (i.e., rainfall intensities should be much higher), and have done something wrong when calculating the increase in discharge (i.e., I should not have negative increases in discharge). Does anyone have any suggestions as to how to fix this? TIA.