And if you then run
dput(head(data, 100))
what do you get? Could you post the output?
And if you then run
dput(head(data, 100))
what do you get? Could you post the output?
structure(list(function..... = c("    verbose = getOption(verbose)",
"{", "    fileExt <- function(x) {", "        db <- grepl(\\\\.[^.]+\\\\.(gz|bz2|xz)$",
"        ans <- sub(.*\\\\.", "        ans[db] <- sub(.*\\\\.([^.]+\\\\.)(gz|bz2|xz)$",
"            x[db])", "        ans", "    }", "    my_read_table <- function(...) {",
"        lcc <- Sys.getlocale(LC_COLLATE)", "        on.exit(Sys.setlocale(LC_COLLATE",
"        Sys.setlocale(LC_COLLATE", "        read.table(...)",
"    }", "    stopifnot(is.character(list))", "    names <- c(as.character(substitute(list(...))[-1L])",
"    if (!is.null(package)) {", "        if (!is.character(package)) ",
"            stop('package' must be a character vector or NULL)",
"    }", "    paths <- find.package(package", "    if (is.null(lib.loc)) ",
"        paths <- c(path.package(package", "            paths)",
"    paths <- unique(normalizePath(paths[file.exists(paths)]))",
"    paths <- paths[dir.exists(file.path(paths", "    dataExts <- tools:::.make_file_exts(data)",
"    if (length(names) == 0L) {", "        db <- matrix(character()",
"        for (path in paths) {", "            entries <- NULL",
"            packageName <- if (file_test(-f", "                DESCRIPTION))) ",
"                basename(path)", "            else .", "            if (file_test(-f",
"                data.rds))) {", "                entries <- readRDS(INDEX)",
"            }", "            else {", "                dataDir <- file.path(path",
"                entries <- tools::list_files_with_type(dataDir",
"                  data)", "                if (length(entries)) {",
"                  entries <- unique(tools::file_path_sans_ext(basename(entries)))",
"                  entries <- cbind(entries", "                }",
"            }", "            if (NROW(entries)) {", "                if (is.matrix(entries) && ncol(entries) == 2L) ",
"                  db <- rbind(db", "                    entries))",
"                else warning(gettextf(data index for package %s is invalid and will be ignored",
"                  sQuote(packageName))", "            }", "        }",
"        colnames(db) <- c(Package", "        footer <- if (missing(package)) ",
"            paste0(Use ", "                \\n", "        else NULL",
"        y <- list(title = Data sets", "            footer = footer)",
"        class(y) <- packageIQR", "        return(y)", "    }",
"    paths <- file.path(paths", "    for (name in names) {",
"        found <- FALSE", "        for (p in paths) {", "            tmp_env <- if (overwrite) ",
"                envir", "            else new.env()", "            if (file_test(-f",
"                rds <- readRDS(file.path(p", "                if (name %in% names(rds)) {",
"                  found <- TRUE", "                  if (verbose) ",
"                    message(sprintf(name=%s:\\t found in Rdata.rds",
"                      name)", "                  thispkg <- sub(.*/([^/]*)/data$",
"                  thispkg <- sub(_.*$", "                  thispkg <- paste0(package:",
"                  objs <- rds[[name]]", "                  lazyLoad(file.path(p",
"                    filter = function(x) x %in% objs)", "                  break",
"                }", "                else if (verbose) ", "                  message(sprintf(name=%s:\\t NOT found in names() of Rdata.rds, i.e.,\\n\\t%s\\n",
"                    name", "                    domain = NA)",
"            }", "            if (file_test(-f", "                warning(zipped data found for package ",
"                  .\\nThat is defunct, so please re-install the package.",
"                  domain = NA)", "                if (file_test(-f",
"                  files <- file.path(p"), list...character.. = c(" envir = .GlobalEnv",
"", "", " x)", " ", " \\\\1\\\\2", "", "", "", "", "", " lcc))",
" C)", "", "", "", " list)", "", "", "", "", " lib.loc", "",
" TRUE)", "", "", " data))]", "", "", " nrow = 0L", "", "", " file.path(path",
"", "", "", " INDEX <- file.path(path", "", "", "", "", " data)",
" ", "", "", "", " )", "", "", "", "", " cbind(packageName",
"", " ", " domain = NA", "", "", " LibPath", "", " sQuote(paste(data(package =",
" to list the data sets in all *available* packages.)", "", " header = NULL",
"", "", "", "", " data)", "", "", "", "", "", "", " file.path(p",
" Rdata.rds))", "", "", "", " ", " domain = NA)", " \\\\1", " ",
" thispkg)", "", " Rdata)", "", "", "", "", " ", " paste(names(rds)",
"", "", " file.path(p", " sQuote(basename(dirname(p)))", " ",
"", " fp <- file.path(p", " scan(fp"), package...NULL = c(" overwrite = TRUE) ",
"", "", "", " x)", " ", "", "", "", "", "", "", "", "", "", "",
"", "", "", "", "", " verbose = verbose)", "", " if (!length(package)) getwd()",
"", "", "", "", "", " ncol = 4L)", "", "", " ", "", "", "", " Meta",
"", "", "", "", "", "", "", "", "", "", "", "", "", "", " dirname(path)",
"", "", " call. = FALSE)", "", "", " Item", "", " .packages(all.available = TRUE))))",
"", "", " results = db", "", "", "", "", "", "", "", "", "",
"", "", " Rdata.rds))) {", "", "", "", "", "", "", " p)", " thispkg)",
"", "", " envir = tmp_env", "", "", "", "", "", " collapse = ,))",
"", "", " Rdata.zip))) {", " ", "", "", " filelist))) ", " what = "
), lib.loc...NULL = c("", "", "", "", "", "", "", "", "", "",
"", "", "", "", "", "", "", "", "", "", "", "", "", " ", "",
"", "", "", "", "", "", "", "", "", "", "", " ", "", "", "",
"", "", "", "", "", "", "", "", "", "", "", " ", "", "", "",
"", "", " Title)", "", " ", "", "", " ", "", "", "", "", "",
"", "", "", "", "", "", "", "", "", "", "", "", "", "", "", "",
"", " ", "", "", "", "", "", " ", "", "", "", "", "", "", "",
" quiet = TRUE))"), X = c("", "", "", "", "", "", "", "", "",
"", "", "", "", "", "", "", "", "", "", "", "", "", "", "", "",
"", "", "", "", "", "", "", "", "", "", "", "", "", "", "", "",
"", "", "", "", "", "", "", "", "", "", "", "", "", "", "", "",
"", "", "", "", "", "", "", "", "", "", "", "", "", "", "", "",
"", "", "", "", "", "", "", "", "", "", "", "", "", "", "", "",
"", "", "", "", "", "", "", "", "", "", "")), row.names = c(NA,
100L), class = "data.frame")```I think I see the problem: There an R function called data(), which is what I think the dput() function is using as input.
How about you run:
interval_data  <- read.csv("fifteenminuteintervaldata.csv")
dput(head(interval_data, 100))
instead?
structure(c("function (..., list = character(), package = NULL, lib.loc = NULL, ",
"    verbose = getOption(\"verbose\"), envir = .GlobalEnv, overwrite = TRUE) ",
"{", "    fileExt <- function(x) {", "        db <- grepl(\"\\\\.[^.]+\\\\.(gz|bz2|xz)$\", x)",
"        ans <- sub(\".*\\\\.\", \"\", x)", "        ans[db] <- sub(\".*\\\\.([^.]+\\\\.)(gz|bz2|xz)$\", \"\\\\1\\\\2\", ",
"            x[db])", "        ans", "    }", "    my_read_table <- function(...) {",
"        lcc <- Sys.getlocale(\"LC_COLLATE\")", "        on.exit(Sys.setlocale(\"LC_COLLATE\", lcc))",
"        Sys.setlocale(\"LC_COLLATE\", \"C\")", "        read.table(...)",
"    }", "    stopifnot(is.character(list))", "    names <- c(as.character(substitute(list(...))[-1L]), list)",
"    if (!is.null(package)) {", "        if (!is.character(package)) ",
"            stop(\"'package' must be a character vector or NULL\")",
"    }", "    paths <- find.package(package, lib.loc, verbose = verbose)",
"    if (is.null(lib.loc)) ", "        paths <- c(path.package(package, TRUE), if (!length(package)) getwd(), ",
"            paths)", "    paths <- unique(normalizePath(paths[file.exists(paths)]))",
"    paths <- paths[dir.exists(file.path(paths, \"data\"))]",
"    dataExts <- tools:::.make_file_exts(\"data\")", "    if (length(names) == 0L) {",
"        db <- matrix(character(), nrow = 0L, ncol = 4L)", "        for (path in paths) {",
"            entries <- NULL", "            packageName <- if (file_test(\"-f\", file.path(path, ",
"                \"DESCRIPTION\"))) ", "                basename(path)",
"            else \".\"", "            if (file_test(\"-f\", INDEX <- file.path(path, \"Meta\", ",
"                \"data.rds\"))) {", "                entries <- readRDS(INDEX)",
"            }", "            else {", "                dataDir <- file.path(path, \"data\")",
"                entries <- tools::list_files_with_type(dataDir, ",
"                  \"data\")", "                if (length(entries)) {",
"                  entries <- unique(tools::file_path_sans_ext(basename(entries)))",
"                  entries <- cbind(entries, \"\")", "                }",
"            }", "            if (NROW(entries)) {", "                if (is.matrix(entries) && ncol(entries) == 2L) ",
"                  db <- rbind(db, cbind(packageName, dirname(path), ",
"                    entries))", "                else warning(gettextf(\"data index for package %s is invalid and will be ignored\", ",
"                  sQuote(packageName)), domain = NA, call. = FALSE)",
"            }", "        }", "        colnames(db) <- c(\"Package\", \"LibPath\", \"Item\", \"Title\")",
"        footer <- if (missing(package)) ", "            paste0(\"Use \", sQuote(paste(\"data(package =\", \".packages(all.available = TRUE))\")), ",
"                \"\\n\", \"to list the data sets in all *available* packages.\")",
"        else NULL", "        y <- list(title = \"Data sets\", header = NULL, results = db, ",
"            footer = footer)", "        class(y) <- \"packageIQR\"",
"        return(y)", "    }", "    paths <- file.path(paths, \"data\")",
"    for (name in names) {", "        found <- FALSE", "        for (p in paths) {",
"            tmp_env <- if (overwrite) ", "                envir",
"            else new.env()", "            if (file_test(\"-f\", file.path(p, \"Rdata.rds\"))) {",
"                rds <- readRDS(file.path(p, \"Rdata.rds\"))",
"                if (name %in% names(rds)) {", "                  found <- TRUE",
"                  if (verbose) ", "                    message(sprintf(\"name=%s:\\t found in Rdata.rds\", ",
"                      name), domain = NA)", "                  thispkg <- sub(\".*/([^/]*)/data$\", \"\\\\1\", p)",
"                  thispkg <- sub(\"_.*$\", \"\", thispkg)",
"                  thispkg <- paste0(\"package:\", thispkg)",
"                  objs <- rds[[name]]", "                  lazyLoad(file.path(p, \"Rdata\"), envir = tmp_env, ",
"                    filter = function(x) x %in% objs)", "                  break",
"                }", "                else if (verbose) ", "                  message(sprintf(\"name=%s:\\t NOT found in names() of Rdata.rds, i.e.,\\n\\t%s\\n\", ",
"                    name, paste(names(rds), collapse = \",\")), ",
"                    domain = NA)", "            }", "            if (file_test(\"-f\", file.path(p, \"Rdata.zip\"))) {",
"                warning(\"zipped data found for package \", sQuote(basename(dirname(p))), ",
"                  \".\\nThat is defunct, so please re-install the package.\", ",
"                  domain = NA)", "                if (file_test(\"-f\", fp <- file.path(p, \"filelist\"))) "
), dim = c(100L, 1L), dimnames = list(c("1", "2", "3", "4", "5",
"6", "7", "8", "9", "10", "11", "12", "13", "14", "15", "16",
"17", "18", "19", "20", "21", "22", "23", "24", "25", "26", "27",
"28", "29", "30", "31", "32", "33", "34", "35", "36", "37", "38",
"39", "40", "41", "42", "43", "44", "45", "46", "47", "48", "49",
"50", "51", "52", "53", "54", "55", "56", "57", "58", "59", "60",
"61", "62", "63", "64", "65", "66", "67", "68", "69", "70", "71",
"72", "73", "74", "75", "76", "77", "78", "79", "80", "81", "82",
"83", "84", "85", "86", "87", "88", "89", "90", "91", "92", "93",
"94", "95", "96", "97", "98", "99", "100"), ""), class = "noquote")```Thanks, Brant — and could you post a screenshot of the output you get when you run just head(interval_data)?
I am amazed that people do not run into more problems using names like "data" and "df".
dput(head(dat1, 100))
structure(list(Date = c("2010-05-01", "2010-05-01", "2010-05-01",
"2010-05-01", "2010-05-01", "2010-05-01", "2010-05-01", "2010-05-01",
"2010-05-01", "2010-05-01", "2010-05-01", "2010-05-01", "2010-05-01",
"2010-05-01", "2010-05-01", "2010-05-01", "2010-05-01", "2010-05-01",
"2010-05-01", "2010-05-01", "2010-05-01", "2010-05-01", "2010-05-01",
"2010-05-01", "2010-05-01", "2010-05-01", "2010-05-01", "2010-05-01",
"2010-05-01", "2010-05-01", "2010-05-01", "2010-05-01", "2010-05-01",
"2010-05-01", "2010-05-01", "2010-05-01", "2010-05-01", "2010-05-01",
"2010-05-01", "2010-05-01", "2010-05-01", "2010-05-01", "2010-05-01",
"2010-05-01", "2010-05-01", "2010-05-01", "2010-05-01", "2010-05-01",
"2010-05-01", "2010-05-01", "2010-05-01", "2010-05-01", "2010-05-01",
"2010-05-01", "2010-05-01", "2010-05-01", "2010-05-01", "2010-05-01",
"2010-05-01", "2010-05-01", "2010-05-01", "2010-05-01", "2010-05-01",
"2010-05-01", "2010-05-01", "2010-05-01", "2010-05-01", "2010-05-01",
"2010-05-01", "2010-05-01", "2010-05-01", "2010-05-01", "2010-05-01",
"2010-05-01", "2010-05-01", "2010-05-01", "2010-05-01", "2010-05-01",
"2010-05-01", "2010-05-01", "2010-05-01", "2010-05-01", "2010-05-01",
"2010-05-01", "2010-05-01", "2010-05-01", "2010-05-01", "2010-05-01",
"2010-05-01", "2010-05-01", "2010-05-01", "2010-05-01", "2010-05-01",
"2010-05-01", "2010-05-01", "2010-05-01", "2010-05-02", "2010-05-02",
"2010-05-02", "2010-05-02"), Time = c("0:00:00", "0:15:00", "0:30:00",
"0:45:00", "1:00:00", "1:15:00", "1:30:00", "1:45:00", "2:00:00",
"2:15:00", "2:30:00", "2:45:00", "3:00:00", "3:15:00", "3:30:00",
"3:45:00", "4:00:00", "4:15:00", "4:30:00", "4:45:00", "5:00:00",
"5:15:00", "5:30:00", "5:45:00", "6:00:00", "6:15:00", "6:30:00",
"6:45:00", "7:00:00", "7:15:00", "7:30:00", "7:45:00", "8:00:00",
"8:15:00", "8:30:00", "8:45:00", "9:00:00", "9:15:00", "9:30:00",
"9:45:00", "10:00:00", "10:15:00", "10:30:00", "10:45:00", "11:00:00",
"11:15:00", "11:30:00", "11:45:00", "12:00:00", "12:15:00", "12:30:00",
"12:45:00", "13:00:00", "13:15:00", "13:30:00", "13:45:00", "14:00:00",
"14:15:00", "14:30:00", "14:45:00", "15:00:00", "15:15:00", "15:30:00",
"15:45:00", "16:00:00", "16:15:00", "16:30:00", "16:45:00", "17:00:00",
"17:15:00", "17:30:00", "17:45:00", "18:00:00", "18:15:00", "18:30:00",
"18:45:00", "19:00:00", "19:15:00", "19:30:00", "19:45:00", "20:00:00",
"20:15:00", "20:30:00", "20:45:00", "21:00:00", "21:15:00", "21:30:00",
"21:45:00", "22:00:00", "22:15:00", "22:30:00", "22:45:00", "23:00:00",
"23:15:00", "23:30:00", "23:45:00", "0:00:00", "0:15:00", "0:30:00",
"0:45:00"), Precipitation = c(0, 0, 0, 0.2, 0.2, 0, 0, 0.2, 0.4,
0, 0, 0.2, 0, 0, 0, 0, 0.2, 0, 0, 0.6, 0.4, 0.2, 0, 0, 0, 0,
0, 0, 0, 0, 0.2, 0, 0, 0, 0, 0, 0, 0, 0, 0, 0, 0, 0, 0, 0, 0,
0, 0, 0, 0, 0, 0, 0, 0, 0, 0, 0, 0, 0, 0, 0, 0, 0, 0, 0, 0, 0,
0, 0, 0, 0, 0, 0, 0, 0, 0, 0, 0, 0, 0, 0, 0, 0, 0, 0, 0, 0, 0,
0, 0, 0, 0, 0, 0, 0, 0, 0, 0, 3, 0), Discharge = c(0.299, 0.302,
0.305, 0.308, 0.312, 0.317, 0.321, 0.326, 0.33, 0.339, 0.352,
0.38, 0.41, 0.428, 0.424, 0.419, 0.415, 0.41, 0.411, 0.412, 0.414,
0.415, 0.416, 0.44, 0.459, 0.465, 0.495, 0.495, 0.495, 0.495,
0.495, 0.495, 0.471, 0.453, 0.44, 0.431, 0.422, 0.423, 0.423,
0.424, 0.424, 0.425, 0.425, 0.426, 0.427, 0.427, 0.428, 0.428,
0.429, 0.429, 0.43, 0.43, 0.431, 0.431, 0.432, 0.432, 0.433,
0.433, 0.434, 0.434, 0.435, 0.441, 0.471, 0.527, 0.565, 0.562,
0.559, 0.556, 0.552, 0.665, 0.892, 0.941, 0.937, 0.933, 0.928,
0.924, 0.843, 0.812, 0.765, 0.729, 0.693, 0.672, 0.644, 0.617,
0.611, 0.591, 0.578, 0.569, 0.559, 0.55, 0.54, 0.538, 0.536,
0.534, 0.532, 0.53, 0.528, 0.526, 0.524, 0.521)), row.names = c(NA,
100L), class = "data.frame")
Meaning, just
head(interval_data)
rather than
dput(head(interval_data))Would it be easier to just view the data from the .csv file that I provided?
It looks like there's something wrong with your R session — the output you should have gotten is what @jrkrideau posted here.
For the moment, his post will do, but it'll be important to sort out what's happening with your R session. It could be that restarting it may be enough to set things right.
Thank you. When I followed @jrkrideau's code I got the same output. Below is my output when I type dput(head(data,100)).
dput(head(data, 100))
structure(list(Date = c("2010-05-01", "2010-05-01", "2010-05-01",
"2010-05-01", "2010-05-01", "2010-05-01", "2010-05-01", "2010-05-01",
"2010-05-01", "2010-05-01", "2010-05-01", "2010-05-01", "2010-05-01",
"2010-05-01", "2010-05-01", "2010-05-01", "2010-05-01", "2010-05-01",
"2010-05-01", "2010-05-01", "2010-05-01", "2010-05-01", "2010-05-01",
"2010-05-01", "2010-05-01", "2010-05-01", "2010-05-01", "2010-05-01",
"2010-05-01", "2010-05-01", "2010-05-01", "2010-05-01", "2010-05-01",
"2010-05-01", "2010-05-01", "2010-05-01", "2010-05-01", "2010-05-01",
"2010-05-01", "2010-05-01", "2010-05-01", "2010-05-01", "2010-05-01",
"2010-05-01", "2010-05-01", "2010-05-01", "2010-05-01", "2010-05-01",
"2010-05-01", "2010-05-01", "2010-05-01", "2010-05-01", "2010-05-01",
"2010-05-01", "2010-05-01", "2010-05-01", "2010-05-01", "2010-05-01",
"2010-05-01", "2010-05-01", "2010-05-01", "2010-05-01", "2010-05-01",
"2010-05-01", "2010-05-01", "2010-05-01", "2010-05-01", "2010-05-01",
"2010-05-01", "2010-05-01", "2010-05-01", "2010-05-01", "2010-05-01",
"2010-05-01", "2010-05-01", "2010-05-01", "2010-05-01", "2010-05-01",
"2010-05-01", "2010-05-01", "2010-05-01", "2010-05-01", "2010-05-01",
"2010-05-01", "2010-05-01", "2010-05-01", "2010-05-01", "2010-05-01",
"2010-05-01", "2010-05-01", "2010-05-01", "2010-05-01", "2010-05-01",
"2010-05-01", "2010-05-01", "2010-05-01", "2010-05-02", "2010-05-02",
"2010-05-02", "2010-05-02"), Time = c("0:00:00", "0:15:00", "0:30:00",
"0:45:00", "1:00:00", "1:15:00", "1:30:00", "1:45:00", "2:00:00",
"2:15:00", "2:30:00", "2:45:00", "3:00:00", "3:15:00", "3:30:00",
"3:45:00", "4:00:00", "4:15:00", "4:30:00", "4:45:00", "5:00:00",
"5:15:00", "5:30:00", "5:45:00", "6:00:00", "6:15:00", "6:30:00",
"6:45:00", "7:00:00", "7:15:00", "7:30:00", "7:45:00", "8:00:00",
"8:15:00", "8:30:00", "8:45:00", "9:00:00", "9:15:00", "9:30:00",
"9:45:00", "10:00:00", "10:15:00", "10:30:00", "10:45:00", "11:00:00",
"11:15:00", "11:30:00", "11:45:00", "12:00:00", "12:15:00", "12:30:00",
"12:45:00", "13:00:00", "13:15:00", "13:30:00", "13:45:00", "14:00:00",
"14:15:00", "14:30:00", "14:45:00", "15:00:00", "15:15:00", "15:30:00",
"15:45:00", "16:00:00", "16:15:00", "16:30:00", "16:45:00", "17:00:00",
"17:15:00", "17:30:00", "17:45:00", "18:00:00", "18:15:00", "18:30:00",
"18:45:00", "19:00:00", "19:15:00", "19:30:00", "19:45:00", "20:00:00",
"20:15:00", "20:30:00", "20:45:00", "21:00:00", "21:15:00", "21:30:00",
"21:45:00", "22:00:00", "22:15:00", "22:30:00", "22:45:00", "23:00:00",
"23:15:00", "23:30:00", "23:45:00", "0:00:00", "0:15:00", "0:30:00",
"0:45:00"), Precipitation = c(0, 0, 0, 0.2, 0.2, 0, 0, 0.2, 0.4,
0, 0, 0.2, 0, 0, 0, 0, 0.2, 0, 0, 0.6, 0.4, 0.2, 0, 0, 0, 0,
0, 0, 0, 0, 0.2, 0, 0, 0, 0, 0, 0, 0, 0, 0, 0, 0, 0, 0, 0, 0,
0, 0, 0, 0, 0, 0, 0, 0, 0, 0, 0, 0, 0, 0, 0, 0, 0, 0, 0, 0, 0,
0, 0, 0, 0, 0, 0, 0, 0, 0, 0, 0, 0, 0, 0, 0, 0, 0, 0, 0, 0, 0,
0, 0, 0, 0, 0, 0, 0, 0, 0, 0, 3, 0), Discharge = c(0.299, 0.302,
0.305, 0.308, 0.312, 0.317, 0.321, 0.326, 0.33, 0.339, 0.352,
0.38, 0.41, 0.428, 0.424, 0.419, 0.415, 0.41, 0.411, 0.412, 0.414,
0.415, 0.416, 0.44, 0.459, 0.465, 0.495, 0.495, 0.495, 0.495,
0.495, 0.495, 0.471, 0.453, 0.44, 0.431, 0.422, 0.423, 0.423,
0.424, 0.424, 0.425, 0.425, 0.426, 0.427, 0.427, 0.428, 0.428,
0.429, 0.429, 0.43, 0.43, 0.431, 0.431, 0.432, 0.432, 0.433,
0.433, 0.434, 0.434, 0.435, 0.441, 0.471, 0.527, 0.565, 0.562,
0.559, 0.556, 0.552, 0.665, 0.892, 0.941, 0.937, 0.933, 0.928,
0.924, 0.843, 0.812, 0.765, 0.729, 0.693, 0.672, 0.644, 0.617,
0.611, 0.591, 0.578, 0.569, 0.559, 0.55, 0.54, 0.538, 0.536,
0.534, 0.532, 0.53, 0.528, 0.526, 0.524, 0.521)), row.names = c(NA,
100L), class = "data.frame")
How do I use this to create plots for the relationships between the precipitation depth (mm), precipitation intensity (mm/hr) and increase in stream discharge (m3/s)?
When I try to plot this using the code
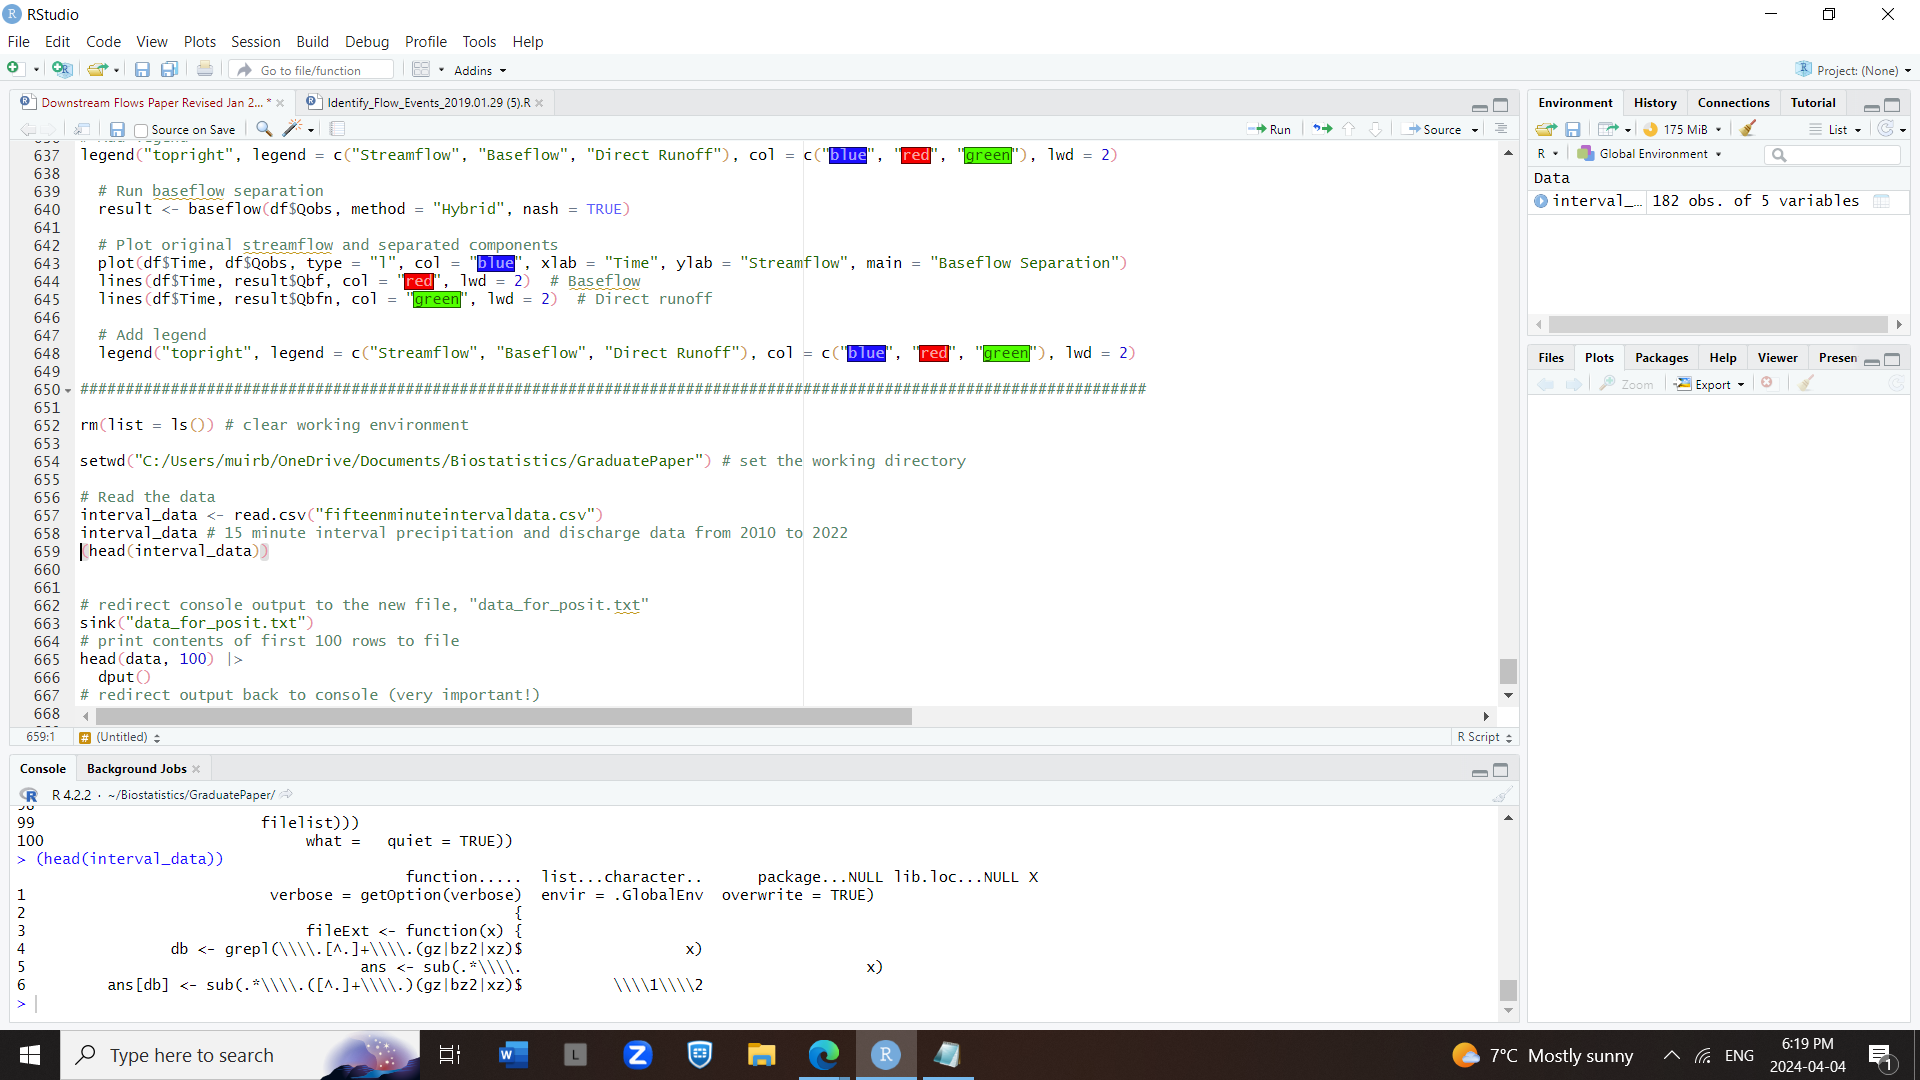
# Read the data
mydata <- read.csv("fifteenminuteintervaldata.csv")
mydata # 15 minute interval precipitation and discharge data from 2010 to 2022
# redirect console output to the new file, "data_for_posit.txt"
sink("data_for_posit.txt")
# print contents of first 100 rows to file
dput(head(mydata, 100))
# redirect output back to console (very important!)
sink()
# Combine date and time columns into a single datetime column
mydata$DateTime <- as.POSIXct(paste(mydata$Date, mydata$Time), format="%Y-%m-%d %H:%M:%S")
mydata <- mydata[, !(names(mydata) %in% c("Date", "Time"))]
# Calculate precipitation intensity (precipitation depth divided by time interval)
mydata$Precipitation_intensity <- mydata$Precipitation / (15 * 60) # Convert 15 minutes to seconds
#Calculate the increase in discharge, you can calculate it by taking the difference between consecutive discharge values
mydata$Increase_in_discharge <- c(NA, diff(mydata$Discharge))
# Plot the correlation between precipitation depth, precipitation intensity, and increase in discharge
library(ggplot2)
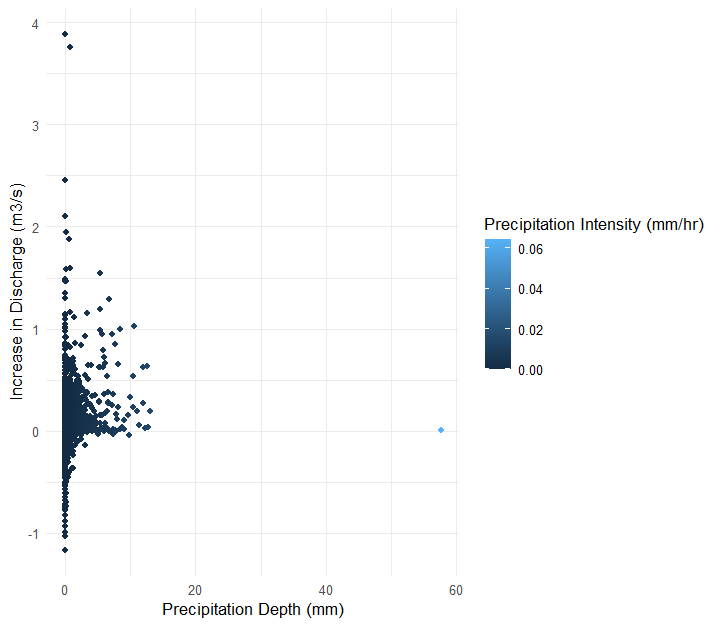
ggplot(mydata, aes(x = Precipitation, y = Increase_in_discharge, color = Precipitation_intensity)) +
geom_point() +
labs(x = "Precipitation Depth (mm)", y = "Increase in Discharge (m3/s)", color = "Precipitation Intensity (mm/hr)") +
theme_minimal()
I get the following plot:
Clearly there are some obvious issues in this plot:
I think that I have both done something wrong when calculating the rainfall intensities (i.e., rainfall intensities should be much higher), and have done something wrong when calculating the increase in discharge (i.e., I should not have negative increases in discharge). Does anyone have any suggestions as to how to fix this? TIA.
In your code, to calculate intensity, you divided the precipitation depth by 900 — didn't you say that intensity should be a rolling sum since you want precipitation per hour?
Why not? A negative increase in discharge means a decrease in discharge — is there a reason why discharge should only increase? Does the data only cover periods when discharge is increasing?
I want the precipitation depth to be the total precipitation that has fallen during each rainfall event (where a rainfall event is defined as the cumulative total precipitation that has fallen consecutively (i.e., no break with 0 mm of precipitation). I want the rainfall intensity to be the average volume of rainfall that has fallen per hour during precipitation events. I also want the the increase in stream discharge to be the increase in stream discharge for a given precipitation depth and intensity.
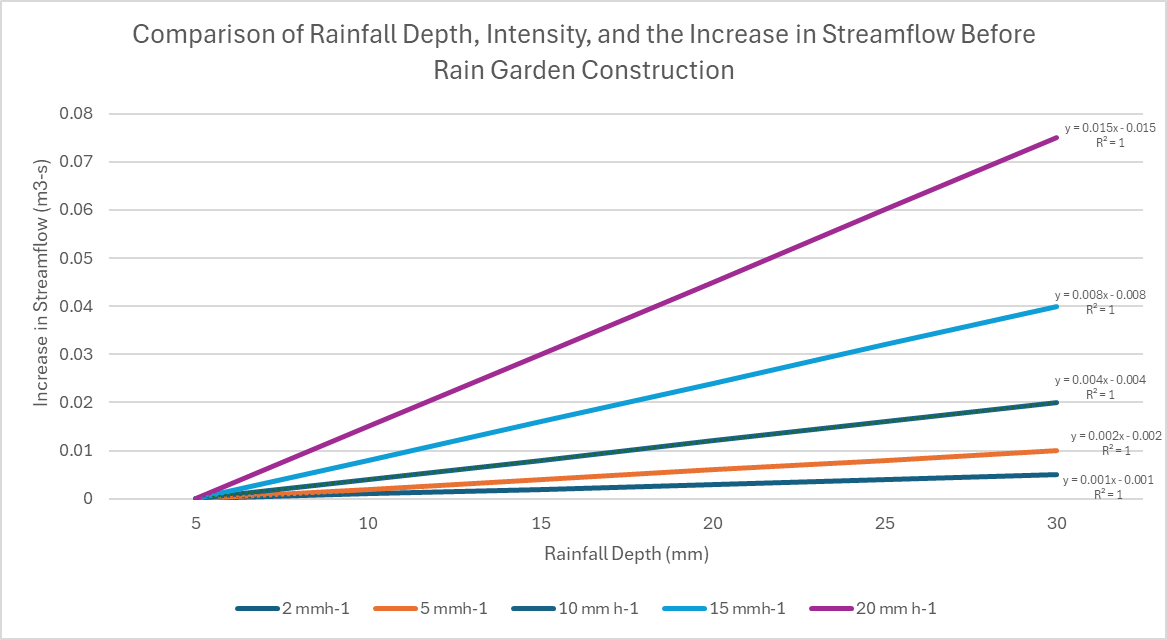
I then want to create a plot similar to the plot below, where I can compare the increase in stream discharge with increasing precipitation depths among different rainfall intensities.
As I am trying to quantify the increase in stream discharge with precipitation events of varying depths and intensities, I am not interested in data when the discharge is decreasing.
If possible I would also like to determine the regression equation of these plots, similar to what is shown below, does anyone have any advice? (again, the data shown in the plot below is not my data, they are arbitrary numbers for illustrative purposes only. Thanks
Hi Brant,
Since this is not directly related to original question, which was about visualization, would you mind creating a new topic for this question?
Ok, I will create a new topic for this question.
This topic was automatically closed 21 days after the last reply. New replies are no longer allowed.
If you have a query related to it or one of the replies, start a new topic and refer back with a link.