Hello--
I would like to make a scatterplot with user-defined overlain line segments in plotly.
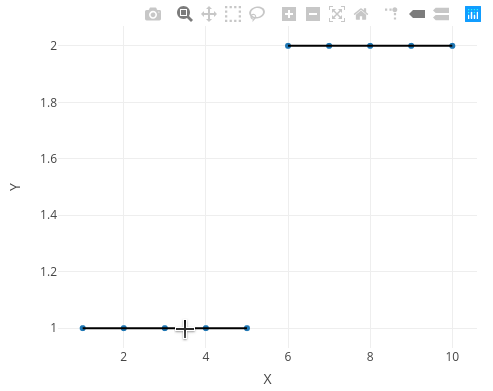
For example, here is a simple version of a plot like that, made with add_segments():
library(plotly)

# Data setup
my_data <- data.frame(X = 1:10, Y = c(rep(1, 5), rep(2, 5)))
segment_loc <- data.frame(
  x = c(1, 6), xend = c(5, 10),
  y = c(1, 2), yend = c(1, 2),
  text = c(
    "The first segment",
    "The second segment"
  )
)

# Plot!
plot_ly(my_data, x = ~X, y = ~Y, hoverinfo = "none") %>%
  add_markers() %>%
  add_segments(
    data = segment_loc, x = ~x, xend = ~xend,
    y = ~y, yend = ~y, color = I("black"),
    hoverinfo = "text", text = ~text
  ) %>%
  hide_legend()

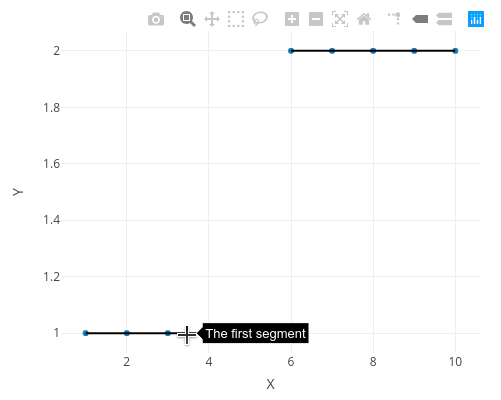
When the user hovers over a segment, they should see the text associated with that segment. The big problem here seems to be that add_segments does not support tooltips/hoverinfo.
This problem was brought up in StackOverflow a few years ago and the two solutions were to either (1) use a different package (highcharter), or (2) use add_lines instead.
Since highcharter doesn't work for my purposes, I have been using the add_lines version. This works, but seems really inefficient and unnecessary. And, on much larger graphs, I think it significantly slows down loading, since plotly has to render multiple points for each line segment:
library(plotly)

# Data setup
my_data <- data.frame(X = 1:10, Y = c(rep(1, 5), rep(2, 5)))
segment_loc <- data.frame(
  x = c(1, 6), xend = c(5, 10),
  y = c(1, 2), yend = c(1, 2),
  text = c(
    "The first segment",
    "The second segment"
  )
)

# Coerse the original segment dataframe into something that works with add_lines()
segment_loc_revised <- data.frame()
for (i in 1:nrow(segment_loc)) {
  row <- segment_loc[i, ]
  segment_x <- seq(row$x, row$xend, length.out = 10)
  segment_y <- seq(row$y, row$yend, length.out = 10)
  text <- rep(row$text, 10)
  segment_loc_revised <- rbind(
    segment_loc_revised,
    data.frame(x = c(segment_x, NA), y = c(segment_y, NA), text = c(text, NA))
  )
}

# Plot!
plot_ly(my_data, x = ~X, y = ~Y, hoverinfo = "none") %>%
  add_markers() %>%
  add_lines(
    data = segment_loc_revised, x = ~x, y = ~y, yend = ~y, color = I("black"),
    connectgaps = F, hoverinfo = "text", text = ~text
  ) %>%
  hide_legend()

Is the lack of a tooltip on the add_segments() function something I should add as an issue on the plotly github repo? Or am I missing something that could make this process more straightforward/efficient?