This is a duplicate of a question from June (here). I'm rephrasing & shortening to make my question more clear. & I posted a plotly issue here. Edit: posted on SO here.
In plotly, you can use add_segments() to add line segments between two points.
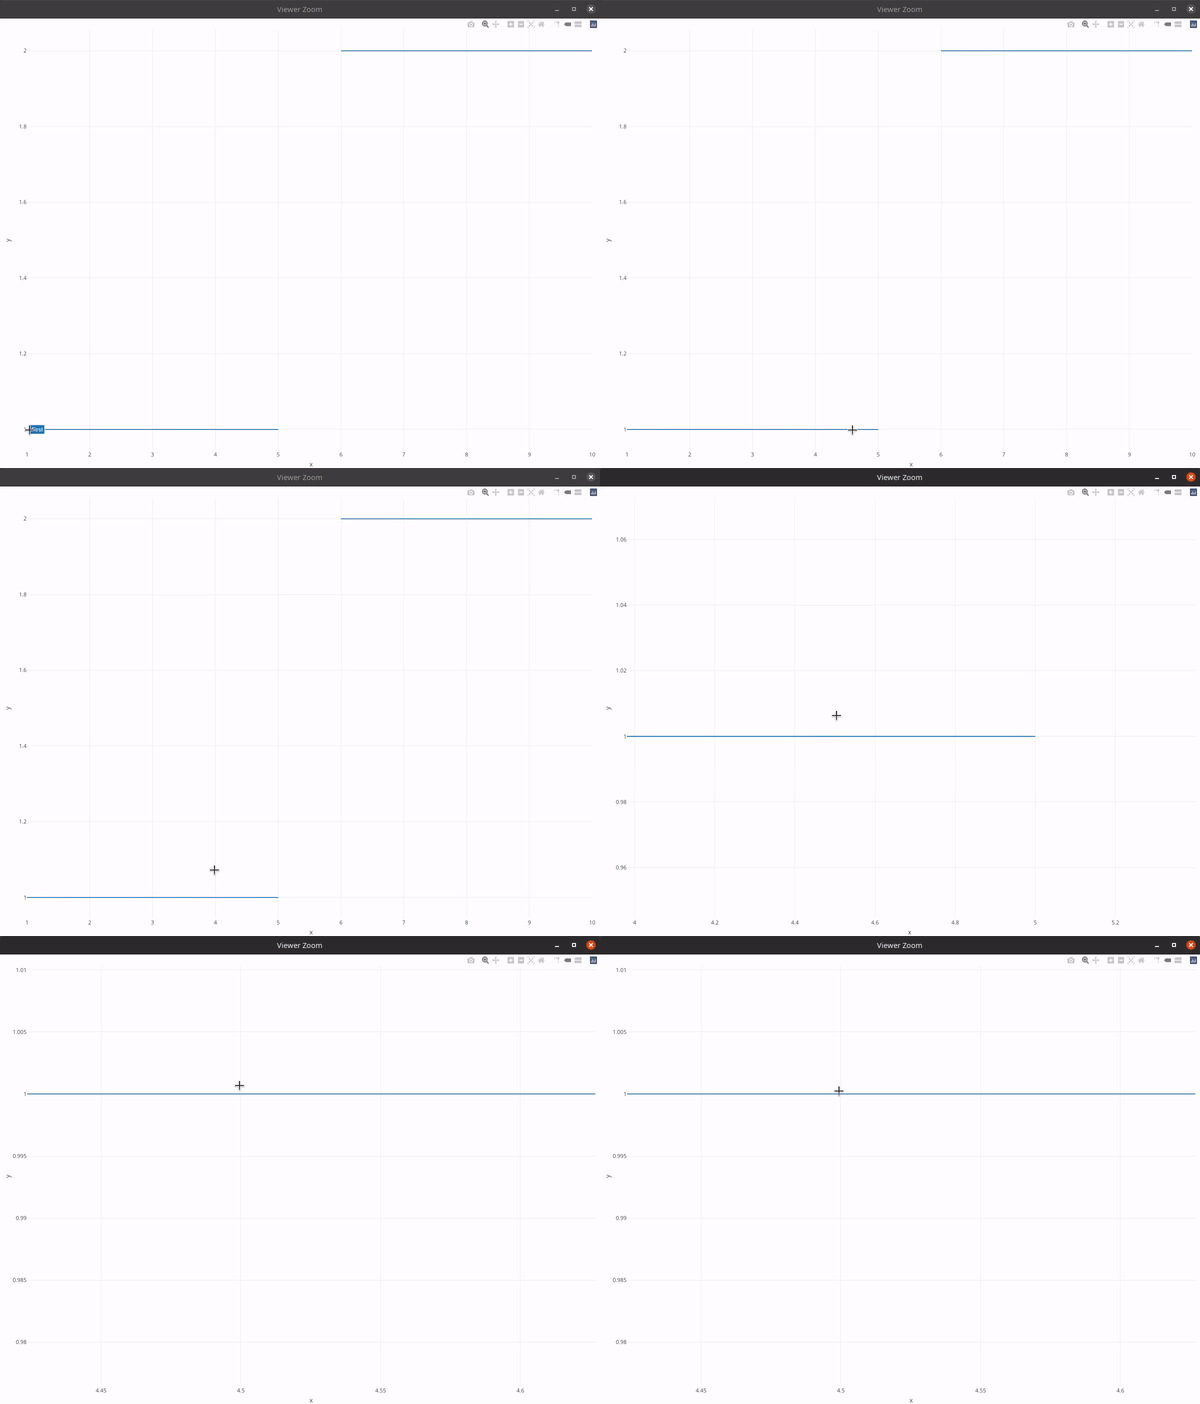
How can I show the user a tooltip when hovering over anywhere on the segment? This seems like it should be feasible from a javascript perspective, but I can't seem to get it to work with plotly.
Example:
library(plotly)
my_data <- data.frame(
  x = c(1, 6), xend = c(5, 10),
  y = c(1, 2), yend = c(1, 2),
  text = c("First", "Second")
)

plot_ly(my_data, x = ~x, xend = ~xend, y = ~y, yend = ~yend,
        text = ~text, hoverinfo = "text") %>%
  add_segments()
Here, a tooltip appears at the ends of the segment, but nowhere else. This is a bigger problem when the user zooms and doesn't know what the segment represents.

The solution given here in stackoverflow suggests to either (1) use highcharter, which would require a lot more changes (I'm using this in a shiny app that relies heavily on plotly), or (2) use add_lines(), which experiences the same problems--if you make a line from just two points, the tooltip only works on those points. You can use n points but, once the user zooms past a certain point, you would need to generate even more points for them to still be able to access the tooltip.
Am I missing something? Do you have any suggestions? Thanks! ![]()