Timeserie (date_time) scatterplot

Hi all, I am New to R. I am trying to make a scatterplot graph with time-series (dt) on my x-axis but it only shows me two dates and not time either, measurements were taken on 25, 26, 27, 28, 29, 30 November and again on 5, 6 December. also each day 4 plants were measured at different times of the day, how can I have all my data series on my x-axis and I would prefer if the Date_time is in a vertical position to fit accordingly on the graph. Kindly see my code and graph.

library(readxl)
Poro_Con <- read_excel("Poro_Conductance_2222-12.xlsx",
sheet = "Analysis File_Poro Data_1.2",
skip = 4)
#scatter plot time series for treated plants
View(Poro_Con)
Poro_Con %>%
ggplot(aes(Date_Time, Conductance)) +
geom_point(alpha=0.4,
aes(colour= Leaf_Section)) +
geom_smooth(method = lm, se = F) +
labs(x= "Date_time",
y= "Conductance",
title= "Treated Plants") +
theme_bw()

What I got (see below)
image

1 Like

do you have a reproducible file to share , or similar sample with data . ?

1 Like

We really need to see some sample data. A handy way to supply some sample data is the dput() function. In the case of a large dataset something like dput(head(mydata, 100)) should supply the data we need. Just do dput(mydata) where mydata is your data. Copy the output and paste it here.

1 Like

Data looks like this, i want Conductance as y-axis and x timeseries

Date_Time Plant_ID Leaf A/B Leaf_Section Conductance
25-Nov-22 4:10 AM C2 a Section 1 195.1
25-Nov-22 4:23 AM C2 b Section 1 53.3
25-Nov-22 8:44 AM C2 a Section 1 149.2
25-Nov-22 9:11 AM C2 b Section 1 150.8
25-Nov-22 3:28 PM C2 a Section 1 214.6
25-Nov-22 3:40 PM C2 b Section 1 29.9
25-Nov-22 8:50 PM C2 a Section 1 37.1
25-Nov-22 9:01 PM C2 b Section 1 31.3
26-Nov-22 4:16 AM C2 b Section 1 84.5
26-Nov-22 4:27 AM C2 a Section 1 160.4
26-Nov-22 9:22 AM C2 a Section 1 223.8
26-Nov-22 9:28 AM C2 b Section 1 121.7
26-Nov-22 12:57 PM C2 a Section 1 145.8
26-Nov-22 1:01 PM C2 b Section 1 43.1
26-Nov-22 4:11 PM C2 a Section 1 54.1
26-Nov-22 4:15 PM C2 b Section 1 27.3
26-Nov-22 6:35 PM C2 a Section 1 56.7
26-Nov-22 6:41 PM C2 b Section 1 31.8
26-Nov-22 9:31 PM C2 a Section 1 64.3
26-Nov-22 9:36 PM C2 b Section 1 78.0
27-Nov-22 5:29 AM C2 b Section 1 134.4
27-Nov-22 5:37 AM C2 a Section 1 163.6
27-Nov-22 8:59 AM C2 a Section 1 118.8
27-Nov-22 9:05 AM C2 b Section 1 162.9
27-Nov-22 12:52 PM C2 a Section 1 148.8
27-Nov-22 12:56 PM C2 b Section 1 50.8
27-Nov-22 3:56 PM C2 a Section 1 164.4
27-Nov-22 4:01 PM C2 b Section 1 51.3
27-Nov-22 7:06 PM C2 a Section 1 77.0

Let me know if this data is okay or you will need more, Thank you, this is just a sample

Date_Time Plant_ID Leaf A/B Leaf_Section Conductance
25-Nov-22 4:10 AM C2 a Section 1 195.1
25-Nov-22 4:23 AM C2 b Section 1 53.3
25-Nov-22 8:44 AM C2 a Section 1 149.2
25-Nov-22 9:11 AM C2 b Section 1 150.8
25-Nov-22 3:28 PM C2 a Section 1 214.6
25-Nov-22 3:40 PM C2 b Section 1 29.9
25-Nov-22 8:50 PM C2 a Section 1 37.1
25-Nov-22 9:01 PM C2 b Section 1 31.3
26-Nov-22 4:16 AM C2 b Section 1 84.5
26-Nov-22 4:27 AM C2 a Section 1 160.4
26-Nov-22 9:22 AM C2 a Section 1 223.8
26-Nov-22 9:28 AM C2 b Section 1 121.7
26-Nov-22 12:57 PM C2 a Section 1 145.8
26-Nov-22 1:01 PM C2 b Section 1 43.1
26-Nov-22 4:11 PM C2 a Section 1 54.1
26-Nov-22 4:15 PM C2 b Section 1 27.3
26-Nov-22 6:35 PM C2 a Section 1 56.7
26-Nov-22 6:41 PM C2 b Section 1 31.8
26-Nov-22 9:31 PM C2 a Section 1 64.3
26-Nov-22 9:36 PM C2 b Section 1 78.0
27-Nov-22 5:29 AM C2 b Section 1 134.4
27-Nov-22 5:37 AM C2 a Section 1 163.6
27-Nov-22 8:59 AM C2 a Section 1 118.8
27-Nov-22 9:05 AM C2 b Section 1 162.9
27-Nov-22 12:52 PM C2 a Section 1 148.8
27-Nov-22 12:56 PM C2 b Section 1 50.8
27-Nov-22 3:56 PM C2 a Section 1 164.4
27-Nov-22 4:01 PM C2 b Section 1 51.3
27-Nov-22 7:06 PM C2 a Section 1 77.0
27-Nov-22 7:11 PM C2 b Section 1 81.5
27-Nov-22 10:02 PM C2 a Section 1 229.7
27-Nov-22 10:14 PM C2 b Section 1 154.1
28-Nov-22 7:30 AM C2 a Section 1 190.0
28-Nov-22 7:45 AM C2 b Section 1 151.2
28-Nov-22 10:00 AM C2 a Section 1 463.0
28-Nov-22 10:07 AM C2 b Section 1 191.0
28-Nov-22 12:40 PM C2 a Section 1 116.3
28-Nov-22 12:45 PM C2 b Section 1 69.6
28-Nov-22 3:40 PM C2 a Section 1 71.5
28-Nov-22 3:47 PM C2 b Section 1 54.3
28-Nov-22 6:53 PM C2 a Section 1 230.1
28-Nov-22 7:01 PM C2 b Section 1 38.3
28-Nov-22 9:18 PM C2 a Section 1 68.1
28-Nov-22 9:31 PM C2 b Section 1 81.3
29-Nov-22 4:38 AM C2 b Section 1 332.0
29-Nov-22 8:17 AM C2 a Section 1 168.9
29-Nov-22 8:24 AM C2 b Section 1 128.9
29-Nov-22 12:01 PM C2 a Section 1 55.7
29-Nov-22 12:05 PM C2 b Section 1 57.9
29-Nov-22 3:26 PM C2 a Section 1 87.8
29-Nov-22 3:31 PM C2 b Section 1 45.0
29-Nov-22 6:06 PM C2 a Section 1 53.7
29-Nov-22 6:10 PM C2 b Section 1 56.8
29-Nov-22 8:29 PM C2 a Section 1 50.3
29-Nov-22 8:34 PM C2 b Section 1 74.2
30-Nov-22 3:48 AM C2 a Section 1 129.9
30-Nov-22 3:55 AM C2 b Section 1 98.2
30-Nov-22 9:31 AM C2 a Section 1 78.4
30-Nov-22 9:35 AM C2 b Section 1 51.0
30-Nov-22 11:04 AM C2 b Section 1 48.1
30-Nov-22 11:08 AM C2 a Section 1 45.8
30-Nov-22 1:32 PM C2 a Section 1 39.6
30-Nov-22 1:34 PM C2 b Section 1 42.4
30-Nov-22 4:08 PM C2 a Section 1 40.7
30-Nov-22 4:12 PM C2 b Section 1 40.3
30-Nov-22 6:27 PM C2 a Section 1 143.3
30-Nov-22 6:30 PM C2 b Section 1 39.8
30-Nov-22 10:12 PM C2 a Section 1 34.0
30-Nov-22 10:15 PM C2 b Section 1 41.2
06-Dec-22 4:59 AM C2 a Section 1 211.0
06-Dec-22 5:25 AM C2 b Section 1 116.1
06-Dec-22 9:20 AM C2 a Section 1 188.1
06-Dec-22 9:27 AM C2 b Section 1 152.9
06-Dec-22 11:59 AM C2 a Section 1 127.4
06-Dec-22 12:07 PM C2 b Section 1 61.4
06-Dec-22 4:06 PM C2 a Section 1 152.8
06-Dec-22 4:12 PM C2 b Section 1 37.7
06-Dec-22 6:47 PM C2 a Section 1 98.5
06-Dec-22 6:52 PM C2 b Section 1 43.4
06-Dec-22 9:45 PM C2 a Section 1 106.5
06-Dec-22 9:50 PM C2 b Section 1 103.4
07-Dec-22 4:17 AM C2 a Section 1 192.3
07-Dec-22 4:28 AM C2 b Section 1 238.6
07-Dec-22 10:07 AM C2 a Section 1 210.2
07-Dec-22 10:13 AM C2 b Section 1 112.3
07-Dec-22 12:08 PM C2 a Section 1 136.2
07-Dec-22 12:14 PM C2 b Section 1 66.0
07-Dec-22 4:16 PM C2 a Section 1 247.8
07-Dec-22 4:19 PM C2 b Section 1 66.8
07-Dec-22 6:35 PM C2 a Section 1 194.1
07-Dec-22 6:39 PM C2 b Section 1 50.2
07-Dec-22 9:37 PM C2 a Section 1 81.3
07-Dec-22 9:41 PM C2 b Section 1 79.1
25-Nov-22 4:16 AM C2 a Section 2 52.0
25-Nov-22 4:26 AM C2 b Section 2 60.2
25-Nov-22 8:47 AM C2 a Section 2 143.2
25-Nov-22 8:55 AM C2 b Section 2 202.0
25-Nov-22 3:34 PM C2 a Section 2 27.6
25-Nov-22 3:41 PM C2 b Section 2 64.5
25-Nov-22 8:56 PM C2 a Section 2 24.7
25-Nov-22 9:05 PM C2 b Section 2 26.8
26-Nov-22 4:19 AM C2 b Section 2 70.7
26-Nov-22 4:30 AM C2 a Section 2 70.9

At a very first glance, you have 103 observations. I doubt that you can get all the data points labeled and still have a legible graph. I believe that {ggplot} uses an algorithm to come up with reasonable data point labeling. One does not really need every point labeled. Your problem seems that they are clustered around two sets of dates with 65 in November and 38 in December. but without much spread. I suspect you will need to manually specify some x-axis label but I am not sure how to go about it and I have to sign-off soon.

It occurs to me that you might be better off plotting the November and December data separately but with tho same y-axis scale and presenting the result as a two panel figure.

The data is okay but it would be better in dput() format. dput() produces an "exact" copy of your data. As it is I can read in your data as a tab--delimited file but what I get is Date_Time as a character variable. In this case it is obvious that you have converted it to a time variable but often it is not obvious.

Here is an example of what dput() gives from a data set I have loaded.

 dput(head(dat1, 10))
structure(list(Date_Time = c("25-Nov-22 4:10 AM", "25-Nov-22 4:23 AM", 
"25-Nov-22 8:44 AM", "25-Nov-22 9:11 AM", "25-Nov-22 3:28 PM", 
"25-Nov-22 3:40 PM", "25-Nov-22 8:50 PM", "25-Nov-22 9:01 PM", 
"26-Nov-22 4:16 AM", "26-Nov-22 4:27 AM"), Plant_ID = c("C2", 
"C2", "C2", "C2", "C2", "C2", "C2", "C2", "C2", "C2"), `Leaf A/B` = c("a", 
"b", "a", "b", "a", "b", "a", "b", "b", "a"), Leaf_Section = c("Section 1", 
"Section 1", "Section 1", "Section 1", "Section 1", "Section 1", 
"Section 1", "Section 1", "Section 1", "Section 1"), Conductance = c(195.1, 
53.3, 149.2, 150.8, 214.6, 29.9, 37.1, 31.3, 84.5, 160.4)), row.names = c(NA, 
10L), class = "data.frame")

Thank you for your time, separating November and December is a good idea. Based on my data, I have 1,111 observations (November and December). How ist possible to list all of them using the d(put) function?

Just do dput(mydata) where mydata is the name of your data.frame or tibble. Howewer we probably do not need anything more than what you have already supplied. It looks like it is enough for us to get a feel for the data. With 1,111 obs, I moro and more like the idea of two plots.

Thank you, so where exactly do I need to insert this dput() within my codes provided below

View(Poro_Con)
Poro_Con %>%
ggplot(aes(Date_Time, Conductance)) +
geom_point(alpha=0.4,
aes(colour= Leaf_Section)) +
geom_smooth(method = lm, se = F) +
labs(x= "Date_time",
y= "Conductance",
title= "Treated Plants") +
theme_bw()

You do not have to insert it anywhere in particular as long as you have Poro_Con loaded. depu() is a stand-alone function.

To supply the first 100 rows of data simply type
dput(head(Poro_Con, 100))

and then copy the output and paste it here.   Anyone on the forum can copy it   put something like

mydata <-

in front of it, run it and, presto, they have an exact copy of the first 100 rows of the data that you are working with.

Will do so and paste here

Here is a bit of a suggestion based on the data you supplied. Note I used {data.table} because it was convenient for me but you can do the same with base R or {tidyverse}.

library(patchwork)
library(data.table)
library(ggplot2)

 ## data in dput format below tho code.
mydat <- as.data.table(mydat) 

mydat$Date_Time <- dmy_hm(mydat$Date_Time)

DD <- mydat[Date_Time > ymd("2022-11-30")]
DN <- mydat[Date_Time <= ymd("2022-11-30")]

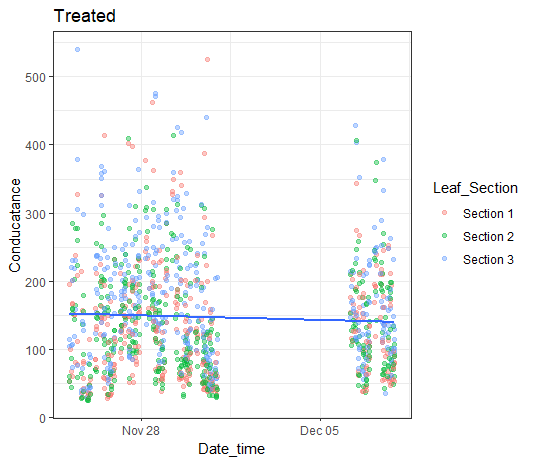
pdec  <- DD  %>%  ggplot(aes(Date_Time, Conductance)) + geom_point() +
         geom_point(alpha=0.4, aes(colour= Leaf_Section)) +
                   ylim(0, 500) +
                geom_smooth(method = lm, se = F) +
              labs(x= "Date_time",  y= "Conductance") +
                 theme(legend.position="none") 
  
pnov <-  DN  %>%  ggplot(aes(Date_Time, Conductance)) + geom_point()+
              geom_point(alpha=0.4, aes(colour= Leaf_Section)) +
                 ylim(0, 500) + 
                geom_smooth(method = lm, se = F) +
                  labs(x= "Date_time",  y= "Conductance")

pnov + pdec


######### data in data.frame layout#########################################################


mydat <-  structure(list(Date_Time = c("25-Nov-22 4:10 AM", "25-Nov-22 4:23 AM", "25-Nov-22 8:44 AM", "25-Nov-22 9:11 AM", "25-Nov-22 3:28 PM", "25-Nov-22 3:40 PM", 
                             "25-Nov-22 8:50 PM", "25-Nov-22 9:01 PM", "26-Nov-22 4:16 AM", "26-Nov-22 4:27 AM", "26-Nov-22 9:22 AM", "26-Nov-22 9:28 AM", "26-Nov-22 12:57 PM", 
                             "26-Nov-22 1:01 PM", "26-Nov-22 4:11 PM", "26-Nov-22 4:15 PM", "26-Nov-22 6:35 PM", "26-Nov-22 6:41 PM", "26-Nov-22 9:31 PM", "26-Nov-22 9:36 PM", 
                             "27-Nov-22 5:29 AM", "27-Nov-22 5:37 AM", "27-Nov-22 8:59 AM", "27-Nov-22 9:05 AM", "27-Nov-22 12:52 PM", "27-Nov-22 12:56 PM", "27-Nov-22 3:56 PM",
                             "27-Nov-22 4:01 PM", "27-Nov-22 7:06 PM", "27-Nov-22 7:11 PM", "27-Nov-22 10:02 PM", "27-Nov-22 10:14 PM", "28-Nov-22 7:30 AM", "28-Nov-22 7:45 AM", 
                             "28-Nov-22 10:00 AM", "28-Nov-22 10:07 AM", "28-Nov-22 12:40 PM", "28-Nov-22 12:45 PM", "28-Nov-22 3:40 PM", "28-Nov-22 3:47 PM", "28-Nov-22 6:53 PM", 
                             "28-Nov-22 7:01 PM", "28-Nov-22 9:18 PM", "28-Nov-22 9:31 PM", "29-Nov-22 4:38 AM", "29-Nov-22 8:17 AM", "29-Nov-22 8:24 AM", "29-Nov-22 12:01 PM", 
                             "29-Nov-22 12:05 PM", "29-Nov-22 3:26 PM", "29-Nov-22 3:31 PM", "29-Nov-22 6:06 PM", "29-Nov-22 6:10 PM", "29-Nov-22 8:29 PM", "29-Nov-22 8:34 PM", 
                             "30-Nov-22 3:48 AM", "30-Nov-22 3:55 AM", "30-Nov-22 9:31 AM", "30-Nov-22 9:35 AM", "30-Nov-22 11:04 AM", "30-Nov-22 11:08 AM", "30-Nov-22 1:32 PM",
                             "30-Nov-22 1:34 PM", "30-Nov-22 4:08 PM", "30-Nov-22 4:12 PM", "30-Nov-22 6:27 PM", "30-Nov-22 6:30 PM", "30-Nov-22 10:12 PM", "30-Nov-22 10:15 PM", 
                             "06-Dec-22 4:59 AM", "06-Dec-22 5:25 AM", "06-Dec-22 9:20 AM", "06-Dec-22 9:27 AM", "06-Dec-22 11:59 AM", "06-Dec-22 12:07 PM", "06-Dec-22 4:06 PM", 
                             "06-Dec-22 4:12 PM", "06-Dec-22 6:47 PM", "06-Dec-22 6:52 PM", "06-Dec-22 9:45 PM", "06-Dec-22 9:50 PM", "07-Dec-22 4:17 AM", "07-Dec-22 4:28 AM", 
                             "07-Dec-22 10:07 AM", "07-Dec-22 10:13 AM", "07-Dec-22 12:08 PM", "07-Dec-22 12:14 PM", "07-Dec-22 4:16 PM", "07-Dec-22 4:19 PM", "07-Dec-22 6:35 PM", 
                             "07-Dec-22 6:39 PM", "07-Dec-22 9:37 PM", "07-Dec-22 9:41 PM", "25-Nov-22 4:16 AM", "25-Nov-22 4:26 AM", "25-Nov-22 8:47 AM", "25-Nov-22 8:55 AM",
                             "25-Nov-22 3:34 PM", "25-Nov-22 3:41 PM", "25-Nov-22 8:56 PM", "25-Nov-22 9:05 PM", "26-Nov-22 4:19 AM", "26-Nov-22 4:30 AM"), 
               Plant_ID = c("C2", "C2", "C2", "C2", "C2", "C2", "C2", "C2", "C2", "C2", "C2", "C2", "C2", "C2", "C2", "C2", "C2", "C2", "C2", "C2", "C2", "C2", "C2",
                            "C2", "C2", "C2", "C2", "C2", "C2", "C2", "C2", "C2", "C2", "C2", "C2", "C2", "C2", "C2", "C2", "C2", "C2", "C2", "C2", "C2", "C2", "C2", 
                            "C2", "C2", "C2", "C2", "C2", "C2", "C2", "C2", "C2", "C2", "C2", "C2", "C2", "C2", "C2", "C2", "C2", "C2", "C2", "C2", "C2", "C2", "C2", 
                            "C2", "C2", "C2", "C2", "C2", "C2", "C2", "C2", "C2", "C2", "C2", "C2", "C2", "C2", "C2", "C2", "C2", "C2", "C2", "C2", "C2", "C2", "C2", 
                            "C2", "C2", "C2", "C2", "C2", "C2", "C2", "C2", "C2", "C2", "C2"), 
               Leaf.A.B = c("a", "b", "a", "b", "a", "b", "a", "b", "b", "a", "a", "b", "a", "b", "a", "b", "a", "b", "a", "b", "b", "a", "a", "b", "a", "b", "a", 
                            "b", "a", "b", "a", "b", "a", "b", "a", "b", "a", "b", "a", "b", "a", "b", "a", "b", "b", "a", "b", "a", "b", "a", "b", "a", "b", "a", "b", 
                            "a", "b", "a", "b", "b", "a", "a", "b", "a", "b", "a", "b", "a", "b", "a", "b", "a", "b", "a", "b", "a", "b", "a", "b", "a", "b", "a", "b", 
                            "a", "b", "a", "b", "a", "b", "a", "b", "a", "b", "a", "b", "a", "b", "a", "b", "a", "b", "b", "a"), 
               Leaf_Section = c("Section 1", "Section 1", "Section 1", "Section 1", "Section 1", "Section 1", "Section 1", "Section 1", "Section 1", "Section 1",
                                "Section 1", "Section 1", "Section 1", "Section 1", "Section 1", "Section 1", "Section 1", "Section 1", "Section 1", "Section 1", 
                                "Section 1", "Section 1", "Section 1", "Section 1", "Section 1", "Section 1", "Section 1", "Section 1", "Section 1", "Section 1", 
                                "Section 1", "Section 1", "Section 1", "Section 1", "Section 1", "Section 1", "Section 1", "Section 1", "Section 1", "Section 1",
                                "Section 1", "Section 1", "Section 1", "Section 1", "Section 1", "Section 1", "Section 1", "Section 1", "Section 1", "Section 1", 
                                "Section 1", "Section 1", "Section 1", "Section 1", "Section 1", "Section 1", "Section 1", "Section 1", "Section 1", "Section 1", 
                                "Section 1", "Section 1", "Section 1", "Section 1", "Section 1", "Section 1", "Section 1", "Section 1", "Section 1", "Section 1", 
                                "Section 1", "Section 1", "Section 1", "Section 1", "Section 1", "Section 1", "Section 1", "Section 1", "Section 1", "Section 1", 
                                "Section 1", "Section 1", "Section 1", "Section 1", "Section 1", "Section 1", "Section 1", "Section 1", "Section 1", "Section 1", 
                                "Section 1", "Section 1", "Section 1", "Section 2", "Section 2", "Section 2", "Section 2", "Section 2", "Section 2", "Section 2", 
                                "Section 2", "Section 2", "Section 2"), 
               Conductance = c(195.1, 53.3, 149.2, 150.8, 214.6, 29.9, 37.1, 31.3, 84.5, 160.4, 223.8,  121.7, 145.8, 43.1, 54.1, 27.3, 56.7, 31.8, 64.3, 78, 134.4,
                               163.6, 118.8, 162.9, 148.8, 50.8, 164.4, 51.3, 77, 81.5, 229.7, 154.1, 190, 151.2, 463, 191, 116.3, 69.6, 71.5, 54.3, 230.1, 38.3, 68.1, 
                               81.3, 332, 168.9, 128.9, 55.7, 57.9, 87.8, 45, 53.7, 56.8, 50.3, 74.2, 129.9, 98.2, 78.4, 51, 48.1, 45.8, 39.6, 42.4, 40.7, 40.3, 143.3, 
                               39.8, 34, 41.2, 211, 116.1, 188.1, 152.9, 127.4, 61.4, 152.8, 37.7, 98.5, 43.4, 106.5, 103.4, 192.3, 238.6, 210.2, 112.3, 136.2, 66, 247.8, 
                               66.8, 194.1, 50.2, 81.3, 79.1, 52, 60.2, 143.2, 202, 27.6, 64.5, 24.7, 26.8, 70.7, 70.9)), class = "data.frame", row.names = c(NA, -103L))

Here is the whole dataset, I am interested to plot date_time (y)against Conductance (x).
November and December data separately but with the same y-axis scale and presenting the result as a two-panel figure.

Date Date_Time Plant_ID Period VLOOKUP(Plant ID_Period) Leaf A/B Leaf_Section VLOOKUP(Plant ID_Leaf A/B_Leaf Section_Period) Phase Poro Flir File No Temp Comments Conductance Poro_temp Serial Number CalNum Poro Leaf Sensor % RH Poro Filter Sensor % RH

1040 2022-11-27 2022-11-27 04:20:51 C8 11 C8_Section 3 a Section 3 C8-11-a-Section 3 1 2 517 8.3 NA 220.3 15.0 LPS2601 3602101 36.4 15.7
1041 2022-11-27 2022-11-27 04:23:15 C8 11 C8_Section 3 b Section 3 C8-11-b-Section 3 1 2 514 7.8 NA 126.6 15.0 LPS2601 3602101 27.4 12.1
1042 2022-11-27 2022-11-27 08:05:01 C8 12 C8_Section 3 a Section 3 C8-12-a-Section 3 1 2 568 12.8 NA 184.4 20.1 LPS2601 3602101 36.3 16.2
1043 2022-11-27 2022-11-27 08:12:42 C8 12 C8_Section 3 b Section 3 C8-12-b-Section 3 1 2 571 21.7 NA 209.9 21.4 LPS2601 3602101 38.4 17.1
1044 2022-11-27 2022-11-27 12:02:30 C8 13 C8_Section 3 a Section 3 C8-13-a-Section 3 1 2 616 35.7 NA 223.2 28.3 LPS2601 3602101 38.5 16.6
1045 2022-11-27 2022-11-27 12:09:08 C8 13 C8_Section 3 b Section 3 C8-13-b-Section 3 1 2 619 38.5 NA 155.1 29.6 LPS2601 3602101 33.5 15.5
1046 2022-11-27 2022-11-27 15:03:37 C8 14 C8_Section 3 a Section 3 C8-14-a-Section 3 1 2 664 29.0 Repeated 253.4 28.9 LPS2601 2902002 39.8 17.2
1047 2022-11-27 2022-11-27 15:12:06 C8 14 C8_Section 3 b Section 3 C8-14-b-Section 3 1 2 667 32.9 Repeated 150.2 31.1 LPS2601 2902002 31.4 14.0
1048 2022-11-27 2022-11-27 18:03:41 C8 15 C8_Section 3 a Section 3 C8-15-a-Section 3 1 2 712 24.7 NA 289.4 24.5 LPS2601 2902002 43.1 19.3
1049 2022-11-27 2022-11-27 18:08:51 C8 15 C8_Section 3 b Section 3 C8-15-b-Section 3 1 2 715 25.1 NA 266.2 24.8 LPS2601 2902002 42.2 19.4
1050 2022-11-27 2022-11-27 20:36:52 C8 16 C8_Section 3 a Section 3 C8-16-a-Section 3 1 2 758 13.8 NA 237.3 16.7 LPS2601 2902002 38.9 18.0
1051 2022-11-27 2022-11-27 20:43:52 C8 16 C8_Section 3 b Section 3 C8-16-b-Section 3 1 2 761 14.0 NA 177.3 16.3 LPS2601 2902002 33.6 15.5
1052 2022-11-28 2022-11-28 03:57:57 C8 17 C8_Section 3 a Section 3 C8-17-a-Section 3 1 1 805 10.0 NA 234.0 11.9 LPS2598 2702004 37.4 18.0
1053 2022-11-28 2022-11-28 04:11:13 C8 17 C8_Section 3 b Section 3 C8-17-b-Section 3 1 1 808 10.2 NA 248.0 11.5 LPS2598 2702004 38.7 19.0
1054 2022-11-28 2022-11-28 11:11:14 C8 18 C8_Section 3 a Section 3 C8-18-a-Section 3 1 2 895 28.2 NA 315.5 25.1 LPS2601 2902002 45.7 21.7
1055 2022-11-28 2022-11-28 11:17:16 C8 18 C8_Section 3 b Section 3 C8-18-b-Section 3 1 2 898 32.9 NA 249.3 25.2 LPS2601 2902002 41.7 19.9
1056 2022-11-28 2022-11-28 13:43:01 C8 19 C8_Section 3 a Section 3 C8-19-a-Section 3 1 2 943 36.4 NA 244.4 29.3 LPS2601 2902002 42.4 21.3
1057 2022-11-28 2022-11-28 13:48:47 C8 19 C8_Section 3 b Section 3 C8-19-b-Section 3 1 2 946 38.1 NA 167.8 30.9 LPS2601 2902002 36.6 19.0
1058 2022-11-28 2022-11-28 16:48:20 C8 20 C8_Section 3 a Section 3 C8-20-a-Section 3 1 2 991 40.7 NA 93.0 30.9 LPS2601 2902002 24.7 11.8
1059 2022-11-28 2022-11-28 16:56:55 C8 20 C8_Section 3 b Section 3 C8-20-b-Section 3 1 2 994 32.8 NA 81.3 30.6 LPS2601 2902002 24.8 13.3
1060 2022-11-28 2022-11-28 20:01:19 C8 21 C8_Section 3 a Section 3 C8-21-a-Section 3 1 2 NA NA Temp not taken due to flir low battery 82.5 21.0 LPS2601 2902002 26.2 14.5
1061 2022-11-28 2022-11-28 20:08:25 C8 21 C8_Section 3 b Section 3 C8-21-b-Section 3 1 2 NA NA Temp not taken due to flir low battery 112.4 20.7 LPS2601 2902002 30.5 16.2
1062 2022-11-28 2022-11-28 23:47:15 C8 22 C8_Section 3 a Section 3 C8-22-a-Section 3 1 2 NA NA Temp not taken due to flir low battery 286.5 14.2 LPS2601 2902002 40.6 18.3
1063 2022-11-28 2022-11-28 23:56:01 C8 22 C8_Section 3 b Section 3 C8-22-b-Section 3 1 2 NA NA Temp not taken due to flir low battery 208.7 14.0 LPS2601 2902002 35.1 15.9
1064 2022-11-29 2022-11-29 10:04:38 C8 24 C8_Section 3 a Section 3 C8-24-a-Section 3 1 2 1027 25.7 NA 325.0 27.4 LPS2601 2902002 46.7 22.8
1065 2022-11-29 2022-11-29 10:11:47 C8 24 C8_Section 3 b Section 3 C8-24-b-Section 3 1 2 1030 37.7 NA 125.1 27.4 LPS2601 2902002 30.3 14.9
1066 2022-11-29 2022-11-29 13:30:36 C8 25 C8_Section 3 a Section 3 C8-25-a-Section 3 1 2 1075 31.8 NA 150.9 32.6 LPS2601 2902002 34.4 17.8
1067 2022-11-29 2022-11-29 13:45:13 C8 25 C8_Section 3 b Section 3 C8-25-b-Section 3 1 2 1078 35.9 NA 64.6 33.7 LPS2601 2902002 21.3 11.5
1068 2022-11-29 2022-11-29 17:10:36 C8 26 C8_Section 3 a Section 3 C8-26-a-Section 3 1 2 1123 37.0 NA 183.9 30.5 LPS2601 3102008 39.4 21.5
1069 2022-11-29 2022-11-29 17:17:46 C8 26 C8_Section 3 a Section 3 C8-26-a-Section 3 1 2 1126 28.9 NA 109.4 30.4 LPS2601 3102008 30.5 16.9
1070 2022-11-29 2022-11-29 19:21:35 C8 27 C8_Section 3 a Section 3 C8-27-a-Section 3 1 2 1170 22.1 NA 218.4 24.4 LPS2601 2802104 39.7 18.4
1071 2022-11-29 2022-11-29 19:28:03 C8 27 C8_Section 3 b Section 3 C8-27-b-Section 3 1 2 1174 21.7 NA 108.1 24.1 LPS2601 2802104 27.5 12.6
1072 2022-11-29 2022-11-29 21:59:56 C8 28 C8_Section 3 a Section 3 C8-28-a-Section 3 1 2 1219 19.3 NA 192.5 21.5 LPS2601 2802104 37.6 17.4
1073 2022-11-29 2022-11-29 22:05:17 C8 28 C8_Section 3 b Section 3 C8-28-b-Section 3 1 2 1222 18.8 NA 102.4 21.4 LPS2601 2802104 27.0 12.5
1074 2022-11-30 2022-11-30 03:05:05 C8 29 C8_Section 3 a Section 3 C8-29-a-Section 3 1 2 1225 14.0 NA 222.7 17.7 LPS2601 2802104 37.8 16.3
1075 2022-11-30 2022-11-30 03:11:47 C8 29 C8_Section 3 b Section 3 C8-29-b-Section 3 1 2 1228 13.5 NA 212.5 17.6 LPS2601 2802104 37.7 16.9
1076 2022-11-30 2022-11-30 08:26:18 C8 30 C8_Section 3 a Section 3 C8-30-a-Section 3 1 2 1276 23.3 NA 313.1 26.4 LPS2601 2802104 45.6 21.0
1077 2022-11-30 2022-11-30 08:32:52 C8 30 C8_Section 3 b Section 3 C8-30-b-Section 3 1 2 1279 32.6 NA 185.8 26.5 LPS2601 2802104 36.8 17.0
1078 2022-11-30 2022-11-30 10:39:54 C8 31 C8_Section 3 a Section 3 C8-31-a-Section 3 1 2 1324 45.3 NA 126.8 43.4 LPS2601 2802104 28.3 12.3
1079 2022-11-30 2022-11-30 10:44:53 C8 31 C8_Section 3 b Section 3 C8-31-b-Section 3 1 2 1327 41.5 NA 62.1 40.5 LPS2601 2802104 17.6 7.5
1080 2022-11-30 2022-11-30 13:07:15 C8 32 C8_Section 3 a Section 3 C8-32-a-Section 3 1 2 1366 41.7 NA 440.8 41.4 LPS2601 2802104 51.1 24.4
1081 2022-11-30 2022-11-30 13:11:23 C8 32 C8_Section 3 b Section 3 C8-32-b-Section 3 1 2 1369 44.2 NA 89.4 42.0 LPS2601 2802104 24.6 11.8
1082 2022-11-30 2022-11-30 15:42:32 C8 33 C8_Section 3 a Section 3 C8-33-a-Section 3 1 2 1414 39.1 NA 84.2 38.8 LPS2601 2802104 23.4 11.1
1083 2022-11-30 2022-11-30 15:45:22 C8 33 C8_Section 3 b Section 3 C8-33-b-Section 3 1 2 1417 41.3 NA 48.6 38.8 LPS2601 2802104 16.3 8.0
1084 2022-11-30 2022-11-30 18:03:00 C8 34 C8_Section 3 a Section 3 C8-34-a-Section 3 1 2 1462 38.5 NA 143.2 35.0 LPS2601 2802104 31.4 14.2
1085 2022-11-30 2022-11-30 18:05:49 C8 34 C8_Section 3 b Section 3 C8-34-b-Section 3 1 2 1465 37.2 NA 56.4 35.2 LPS2601 2802104 17.7 8.2
1086 2022-11-30 2022-11-30 21:11:07 C8 35 C8_Section 3 a Section 3 C8-35-a-Section 3 1 2 1510 25.9 NA 72.4 27.5 LPS2601 2802104 21.6 10.2
1087 2022-11-30 2022-11-30 21:16:12 C8 35 C8_Section 3 b Section 3 C8-35-b-Section 3 1 2 1513 25.9 NA 203.3 27.5 LPS2601 2802104 39.0 18.7
1088 2022-12-06 2022-12-06 06:36:20 C8 1 C8_Section 3 a Section 3 C8-1-a-Section 3 2 1 39 5.5 Sunrise 171.4 12.3 LPS2598 2702004 33.2 16.8
1089 2022-12-06 2022-12-06 06:50:07 C8 1 C8_Section 3 b Section 3 C8-1-b-Section 3 2 1 42 6.8 Sunrise 159.7 14.2 LPS2598 2702004 32.5 16.3
1090 2022-12-06 2022-12-06 10:17:29 C8 2 C8_Section 3 a Section 3 C8-2-a-Section 3 2 2 87 34.9 NA 232.8 30.0 LPS2601 2102004 40.1 18.9
1091 2022-12-06 2022-12-06 10:24:10 C8 2 C8_Section 3 b Section 3 C8-2-b-Section 3 2 2 90 42.5 NA 115.1 29.5 LPS2601 2102004 28.9 14.2
1092 2022-12-06 2022-12-06 12:57:34 C8 3 C8_Section 3 b Section 3 C8-3-b-Section 3 2 2 138 36.4 NA 102.4 30.8 LPS2601 2102004 25.9 12.1
1093 2022-12-06 2022-12-06 13:04:52 C8 3 C8_Section 3 a Section 3 C8-3-a-Section 3 2 2 135 39.3 NA 118.4 30.1 LPS2601 2102004 29.2 14.3
1094 2022-12-06 2022-12-06 16:53:13 C8 4 C8_Section 3 a Section 3 C8-4-a-Section 3 2 2 183 32.1 NA 152.3 32.5 LPS2601 3102002 34.9 18.3
1095 2022-12-06 2022-12-06 16:58:04 C8 4 C8_Section 3 b Section 3 C8-4-b-Section 3 2 2 186 35.5 NA 77.7 32.3 LPS2601 3102002 24.9 13.8
1096 2022-12-06 2022-12-06 19:51:56 C8 5 C8_Section 3 a Section 3 C8-5-a-Section 3 2 2 231 18.9 NA 85.2 21.9 LPS2601 3102002 27.1 15.2
1097 2022-12-06 2022-12-06 19:58:05 C8 5 C8_Section 3 b Section 3 C8-5-b-Section 3 2 2 234 19.8 NA 102.5 21.6 LPS2601 3102002 30.0 16.7
1098 2022-12-06 2022-12-06 22:32:07 C8 6 C8_Section 3 a Section 3 C8-6-a-Section 3 2 2 279 12.8 NA 223.5 17.1 LPS2601 3102002 37.5 16.9
1099 2022-12-06 2022-12-06 22:37:47 C8 6 C8_Section 3 b Section 3 C8-6-b-Section 3 2 2 282 13.6 Repeated 230.0 16.9 LPS2601 3102002 38.0 17.1
1100 2022-12-07 2022-12-07 03:12:52 C8 7 C8_Section 3 a Section 3 C8-7-a-Section 3 2 2 285 9.1 There was fog on the leaves on plant 8,5,1,2,3,all of them 243.1 13.1 LPS2601 1702004 38.1 16.6
1101 2022-12-07 2022-12-07 03:22:49 C8 7 C8_Section 3 b Section 3 C8-7-b-Section 3 2 2 288 8.9 There was fog on the leaves on plant 8,5,1,2,3,all of them 279.5 12.8 LPS2601 1702004 41.0 18.5
1102 2022-12-07 2022-12-07 09:02:14 C8 8 C8_Section 3 a Section 3 C8-8-a-Section 3 2 2 321 21.9 Measurements were started late due to long lasting fog 211.4 21.0 LPS2601 1702004 40.6 19.1
1103 2022-12-07 2022-12-07 09:12:08 C8 8 C8_Section 3 b Section 3 C8-8-b-Section 3 2 2 324 27.7 Measurements were started late due to long lasting fog 252.4 20.6 LPS2601 1702004 43.1 19.7
1104 2022-12-07 2022-12-07 11:15:02 C8 9 C8_Section 3 a Section 3 C8-9-a-Section 3 2 2 369 33.8 Repeated 379.3 28.0 LPS2601 1702004 51.0 25.0
1105 2022-12-07 2022-12-07 11:22:37 C8 9 C8_Section 3 b Section 3 C8-9-b-Section 3 2 2 372 32.0 NA 136.1 28.6 LPS2601 1702004 34.2 17.3
1106 2022-12-07 2022-12-07 15:26:47 C8 10 C8_Section 3 a Section 3 C8-10-a-Section 3 2 2 416 37.5 NA 174.0 31.0 LPS2601 1702004 39.1 20.4
1107 2022-12-07 2022-12-07 15:33:12 C8 10 C8_Section 3 b Section 3 C8-10-b-Section 3 2 2 419 34.9 NA 102.7 31.4 LPS2601 1702004 32.2 18.5
1108 2022-12-07 2022-12-07 18:03:33 C8 11 C8_Section 3 a Section 3 C8-11-a-Section 3 2 2 464 27.1 NA 263.0 28.5 LPS2601 3202105 43.5 20.9
1109 2022-12-07 2022-12-07 18:07:35 C8 11 C8_Section 3 b Section 3 C8-11-b-Section 3 2 2 467 24.6 NA 93.3 28.6 LPS2601 3202105 26.1 12.8
1110 2022-12-07 2022-12-07 20:51:33 C8 12 C8_Section 3 a Section 3 C8-12-a-Section 3 2 2 512 17.8 NA 101.2 22.0 LPS2601 3202105 27.0 12.7
1111 2022-12-07 2022-12-07 20:56:50 C8 12 C8_Section 3 b Section 3 C8-12-b-Section 3 2 2 515 17.4 NA 134.7 21.8 LPS2601 3202105 31.6 14.7

Showing 1,100 to 1,107 of 1,111 entries, 19 total columns

I will give it a try, and give feedback

I'm sorry but that just is not usable data. I managed to paste it into a text editor and read it into R. I got 73 rows & 20 columns of sometimes rather strange looking data. This is from rows 55:65.

In a spreadsheet I am getting this:

I really do not know what to do with it. Where are you pulling the data from? If it is in a .csv file or a spreadsheet, perhaps you could upload it to a file hosting service such as Dropbox or Mediafire and provide us with a link?

Another alternative is that I could give you an email address and you could mail it to me.

I noticed the data is not readable to the way I pasted it. kindly drop me an email me at paulinapawa@gmail.com. Thank you

paulinapawa@gmail.com

Pomwene replied to me off-forum and supplied an Excel data file. See below.

The file is too large to include as dput output and I xam uncertain how to get a representative sample across days so here is a link to the Excel file.

This is a quick summary of the research
*This was a watering experiment where these 4 plants were watered/irrigated with water to assess the before, after and post effects of irrigation.

  1. The plants were measured for 3 days before irrigation (as of 25,26, & 27 November 2022), Watering done on the 27 Nov evening

  2. Measured for another consecutive 3 days after the irrigation event (28,29 &30 November 2022). c)

  3. Plants were remeasured 4 days after irrigation measurements for two days (06-07 December 2022) to measure the post-effect of the moisture applied.

I don't need the exact time, it's impossible, I would
appreciate splitting it into hour segments (break time). Ideally, I want to have an idea of the conductance behaviour before sunset, morning, mid-day and afternoon. The idea to have date and time series is to see which part of the day plants lose more water, and when plants' stomata are closed.*

Here is the code for a first attempt at a graph

library(tidyverse)
Poro_Cond8 %>%  ggplot(aes(DateTime, Conductance,color = Leaf)) +
  geom_point(alpha = 0.6) +  labs(x = "Date and Time",  y = "Conductance (mmol/(m²·s))",
       title = "Treated plants-Watering experiment") +
  scale_x_datetime(date_breaks = "12 hour", date_labels = "%b %d %H:%M") + #scale_x_date() function* to format the dates,%b: Abbreviated month, %d: Day as a number, %H:%M:Hour&minutes date_breaks frequent (or infrequent) breaks along the x-axis
  theme_bw() +
  theme(panel.grid.major = element_blank(),panel.grid.minor = element_blank()) +
  theme(axis.text.x = element_text(angle = 90))  #rotate x-axis labels/change the angle

Pomwene also tried faceting on month (code not available but see plot).
Pomwene.2panel-1.pdf (68.0 KB)

I took another approach but the times are too generalized. Currently,I am thinking of indepetdent panals by day.

DD <- dat1  |> filter(DateTime > ymd("2022-11-30"))
DN <- dat1 |>  filter(DateTime <= ymd("2022-11-30"))


pdec  <- DD  %>%  ggplot(aes(DateTime, Conductance)) + geom_point() +
  geom_point( aes(colour= Leaf_Section)) +
  ylim(0, 600) +
  geom_smooth(method = lm, se = F) +
  labs(x= "Datetime",  y= "Conductance") +
  theme(legend.position="none") 
  

pnov <-  DN  %>%  ggplot(aes(DateTime, Conductance)) + 
  geom_point( aes(colour= Leaf_Section)) +
  ylim(0, 600) + 
  geom_smooth(method = lm, se = F) +
  labs(x= "Date_time",  y= "Conductance") 
  

pnov + pdec

Both of us would appreciate any suggestions you might have.

Thanks.

1 Like

How about this?

library(tidyverse)
library(readxl)

url <- "https://www.dropbox.com/scl/fi/ya3twt4l1vvq9uwaphgvq/Pomwene_R.xlsx?dl=1&rlkey=ipw2rj8nucb904x28kymae3sn"
download.file(url, "sample_data.xlsx")

sample_df <- read_excel("sample_data.xlsx")

sample_df %>% 
    mutate(stage = case_when(
        Date <= '2022-11-27' ~ 'before',
        Date > '2022-11-27' & Date <= '2022-11-30' ~ 'after',
        .default = 'post'),
        stage = factor(stage, levels = c("before", "after", "post"))
    ) %>% 
    ggplot(aes(x = DateTime, y = Conductance)) +
    geom_point(aes(colour = Leaf_Section)) +
    geom_smooth(method = lm, se = F) +
    labs(x = "Datetime",  y = "Conductance") +
    scale_x_datetime(breaks = "1 day", date_labels = "%b %d") +
    facet_wrap(vars(stage), nrow = 1, scales = "free_x") +
    theme(legend.position = "bottom")
#> `geom_smooth()` using formula = 'y ~ x'

Created on 2023-02-28 with reprex v2.0.2

The previous approach could also be used for this by defining hour ranges for each category.