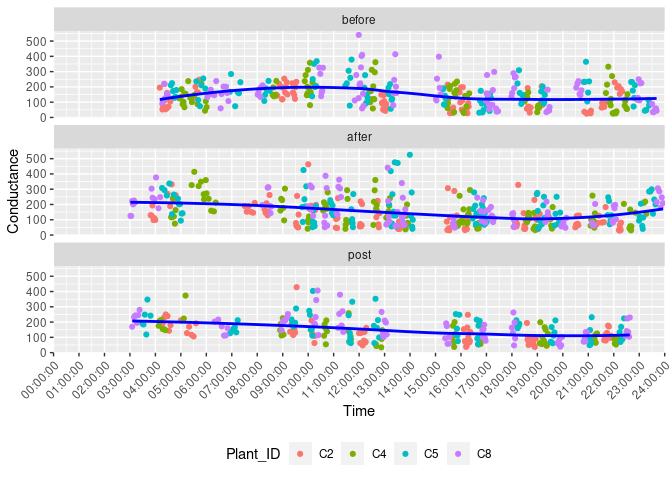
I am still on the "Brute Strength and Stupidity" approach but I think this works although it has too much manual imput.
I am looking at the scale issue but I doubt that know enough about ggplot2 scales to be much help.
The first block of code creates 8 plots of DateTime X Conductance, one for each day. This means that you can do various comparisons as well as plot the entire series.
The second block is an example of doing the same for individual plants. It should be easy to extend to the same scale as the first block or you can just plot odd cobparisons that seem useful.
I hope this is of some use.
First Code Block
library(tidyverse);
library(lubridate);
library(rio);
library(patchwork);

dat1  <- import("Pomwene_R.xlsx")

dng <- unique(dat1$Date)
dng <- ymd(substring(dng,1, 10))  ## Not really needed but it reduces typing

N25 <- dat1  |> filter(Date == dng[1])
N26 <- dat1  |> filter(Date == dng[2])
N27 <- dat1  |> filter(Date == dng[3])
N28 <- dat1  |> filter(Date == dng[4])
N29 <- dat1  |> filter(Date == dng[5])
N30 <- dat1  |> filter(Date == dng[6])
D06 <- dat1  |> filter(Date == dng[7])
D07 <- dat1  |> filter(Date == dng[8])

pN25  <- N25  %>%  ggplot(aes(DateTime, Conductance)) + geom_point() +
  geom_point(alpha=0.4, aes(colour = Leaf)) +
  ylim(0, 500) +
  geom_smooth(method = lm, se = F) +
  labs(x= "Date_time",  y= "Conductance") + ggtitle("Nov. 25")

pN26 <-  N26  %>%  ggplot(aes(DateTime, Conductance)) + geom_point()+
  geom_point(alpha=0.4, aes(colour= )) +  ylim(0, 500) +
  geom_smooth(method = lm, se = F) +
  labs(x= "Date_time",  y= "Conductance") + ggtitle("Nov. 26") +
  theme(legend.position="none")

pN27  <- N27  %>%  ggplot(aes(DateTime, Conductance)) + geom_point() +
    geom_point(alpha=0.4, aes(colour = Leaf)) +
    ylim(0, 500) +  geom_smooth(method = lm, se = F) +
    labs(x= "Date_time",  y= "Conductance") + ggtitle("Nov. 27")

pN28  <- N28  %>%  ggplot(aes(DateTime, Conductance)) + geom_point() +
  geom_point(alpha=0.4, aes(colour = Leaf)) +
  ylim(0, 500) + geom_smooth(method = lm, se = F) +
  labs(x= "Date_time",  y= "Conductance") + ggtitle("Nov. 28") +
  theme(legend.position="none")

pN29  <- N29  %>%  ggplot(aes(DateTime, Conductance)) + geom_point() +
  geom_point(alpha=0.4, aes(colour = Leaf)) +
  ylim(0, 500) +   geom_smooth(method = lm, se = F) +
  labs(x= "Date_time",  y= "Conductance") + ggtitle("Nov. 29")

pN30  <- N30  %>%  ggplot(aes(DateTime, Conductance)) + geom_point() +
  geom_point(alpha=0.4, aes(colour = Leaf)) +
  ylim(0, 500) + geom_smooth(method = lm, se = F) +
  labs(x= "Date_time",  y= "Conductance") + ggtitle("Nov. 28") +
  theme(legend.position="none")


pD06  <- D06  %>%  ggplot(aes(DateTime, Conductance)) + geom_point() +
  geom_point(alpha=0.4, aes(colour = Leaf)) +
  ylim(0, 500) + geom_smooth(method = lm, se = F) +
  labs(x= "Date_time",  y= "Conductance") + ggtitle("Dec. 06") +
  theme(legend.position="none")

pD07  <- D07  %>%  ggplot(aes(DateTime, Conductance)) + geom_point() +
  geom_point(alpha=0.4, aes(colour = Leaf)) +
  ylim(0, 500) + geom_smooth(method = lm, se = F) +
  labs(x= "Date_time",  y= "Conductance") + ggtitle("Nov. 28") +
  theme(legend.position="none")


pN25 + pN26 + pN27 + pN28 + plot_layout(ncol = 2)

# Compare First Day and Last Day Of the Study

pD06 + pD07
Second Code Block
library(tidyverse);
library(lubridate);
library(rio);
library(patchwork)

dat1  <- import("Pomwene_R.xlsx")

dng <- unique(dat1$Date)
dng <- ymd(substring(dng,1, 10))
pid <- c("C2", "C4", "C5", "C8")  # Plant_ID vector

test1 <- dat1  |> filter(Date == dng[1] & Plant_ID == pid[1])

ppf1  <- test1  %>%  ggplot(aes(DateTime, Conductance)) + geom_point() +
  geom_point(alpha=0.4, aes(colour = Leaf)) +
  ylim(0, 500) +
  geom_smooth(method = lm, se = F) +
  labs(x= "Date_time",  y= "Conductance") + ggtitle("Nov. 25, Plant", pid[1])

ppf1
