This is a thread for DATA 412/612 students to practice preparing and sharing code questions using minimal reproducible examples (reprexes). There is no need to respond to these questions, as we're just practicing ![]()
Help. I am trying to create an histogram using a column from my dataset. The code seems to run fine until my ggplot line. It gives an error saying I can't use an integer vector. Is there a way to fix this code?
library(tidyverse)

diabetes <- read.csv("https://raw.githubusercontent.com/malcolmbarrett/au-stats412-612-01-reading_data/master/diabetes.csv")
just_height <- diabetes[, "height"]
ggplot(just_height, aes(x = height)) +
  geom_histogram()
#> Error: `data` must be a data frame, or other object coercible by `fortify()`, not an integer vector.
1 Like
Hello,
My name is Maria McLemore. Are you trying to run a histogram using the ggplot function and using the diabetes file? I think you selected a column instead of the diabetes dataframe. ``` r
diabetes<-read_csv("diabetes.csv")
#> Error in read_csv("diabetes.csv"): could not find function "read_csv"
ggplot(data = diabetes, aes(x = height)) + geom_histogram(color= "black", fill="blue", bins= 10)
#> Error in ggplot(data = diabetes, aes(x = height)): could not find function "ggplot"
<sup>Created on 2021-09-25 by the [reprex package](https://reprex.tidyverse.org) (v2.0.1)</sup>
1 Like
Maria, take a look at the results of your reprex. Do you know why you're getting those errors instead of a plot?
Hello, I try to create a histogram. But it show me an error. I don't know what problem about my code. Is that I use the wrong form about ggplot()? What could I fix it?
library(tidyverse)
diabetes <- read.csv("https://raw.githubusercontent.com/malcolmbarrett/au-stats412-612-01-reading_data/master/diabetes.csv")
just_height <- diabetes[, "height"]
ggplot(just_height, aes(x = height)) +
  geom_histogram()
#> Error: `data` must be a data frame, or other object coercible by `fortify()`, not an integer vector.
Created on 2021-09-26 by the reprex package (v2.0.1)
Hello! I am trying to put together a histogram which correlates height with diabetes, but keep gettig errors telling me my data can not be an integer vector. How do I change the data into an acceptible format?
diabetes <- read.csv("https://raw.githubusercontent.com/malcolmbarrett/au-stats412-612-01-reading_data/master/diabetes.csv")
just_height <- diabetes[, "height"]
ggplot(just_height, aes(x = height)) +
geom_histogram()
Error: data must be a data frame, or other object coercible by fortify(), not an integer vector.
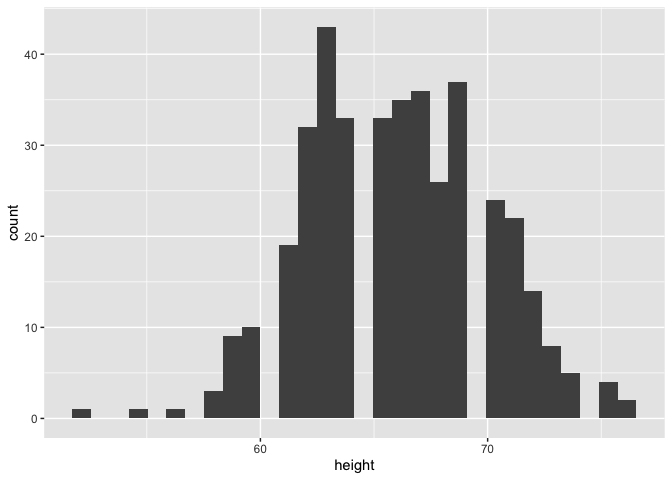
Hello, I am trying to plot a histogram in R using a variable in my dataset. However, the plot appears with 30 bins and some spaces, which I understand as there is no value within this range/bin. Thus, I've tried to change the number of bins to 10 but, still getting this message stat_bin() using bins = 30. Pick better value with binwidth, and the plot does not change at all.
Please advise how should I revise my code to get different bins number? Many thanks!
Below is my code with bins = 10:
# Load tidyverse
library(tidyverse)

# Read diabetes.csv file into a data frame
diabetes <- read_csv("https://raw.githubusercontent.com/malcolmbarrett/au-stats412-612-01-reading_data/master/diabetes.csv")

# Plot ahistogram for the heights variable inside the diabetes data frame
just_height <- data.frame(drop_na(diabetes[, "height"]))

ggplot(just_height, aes(x = height), bins = 10) +
  geom_histogram()
#> `stat_bin()` using `bins = 30`. Pick better value with `binwidth`.
library(ggplot2)
diabetes <- read.csv("https://raw.githubusercontent.com/malcolmbarrett/au-stats412-612-01-reading_data/master/diabetes.csv")
ggplot(diabetes, aes(x = age, y = chol, group = gender, color = gender)) +
geom_line()
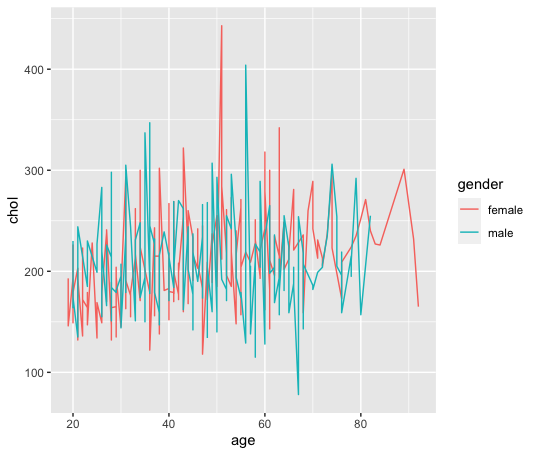
Trying to use reprex package for the codes but every time when I do reprex selection, it crashes my R session. Any ideas why?
@Evan_Malkin, when I try your code on my machine, I get a different error:
diabetes <- read.csv("https://raw.githubusercontent.com/malcolmbarrett/au-stats412-612-01-reading_data/master/diabetes.csv")
just_height <- diabetes[, "height"]
ggplot(just_height, aes(x = height)) +
  geom_histogram()
#> Error in ggplot(just_height, aes(x = height)): could not find function "ggplot"
It seems like you did not use reprex to create your example. What is missing from your code that would help your reprex? In other words, why am I getting a different error than you when I run your code?
@carmen2021 I haven't seen that happen. If you can, please come to one of our office hours or contact me directly and we'll see if we can get you sorted.
Help!
I am trying to create a histogram of height using ggplot. I got an error message saying that my data can not be an integer variable. I think I need to change my data in order to fit the parameters for the ggplot function, but I'm not sure how to do that. How do I change my data into a data frame?
diabetes <- read.csv("https://raw.githubusercontent.com/malcolmbarrett/au-stats412-612-01-reading_data/master/diabetes.csv")
just_height <- diabetes[, "height"]
ggplot(just_height, aes(x = height)) +
  geom_histogram()
#> Error: `data` must be a data frame, or other object coercible by `fortify()`, not an integer vector.
- Hi everyone. I expect this code to create a histogram of only the height variable using the diabetes data set. When I run this code exactly as is, the error I get is that ‘data’ must be a data frame, or other object coercible by ‘fortify()’, not an integer vector.
diabetes <- read.csv("https://raw.githubusercontent.com/malcolmbarrett/au-stats412-612-01-reading_data/master/diabetes.csv")
just_height <- diabetes[, "height"]
ggplot(just_height, aes(x = height)) +
  geom_histogram()
- Prior to adding the ggplot line, the code runs smoothly. I believe when running the ggplot, the error is that we put just_height, which is our new variable, as the dataset we are reading for our ggplot. Our dataset should be diabetes, and then our x variable should be just_height. Also, library(reprex) should be at the beginning of the code so that whoever is using this can reproduce this example.
library(reprex)
diabetes <- read.csv("https://raw.githubusercontent.com/malcolmbarrett/au-stats412-612-01-reading_data/master/diabetes.csv")
just_height <- diabetes[, "height"]
ggplot(diabetes, aes(x = just_height)) +
  geom_histogram()
Hello, can anyone help me with this question? I expect to create a histogram of certain column in a dataset by using ggplot.
library(ggplot2)
chickweight <- datasets::ChickWeight
ggplot(chickweight, aes(x=weight)) +
geom_histogram(color="black", fill="white",bins = 30)
Hello,
I expect this code to create a histogram of the temperature variable in the airquality dataset in base R.
Particularly, I want Temp on the x-axis and count on the y-axis.
When I run this code, R gives me the following output:
#Error: data must be a data frame, or other object coercible by fortify(), not an integer vector.
Can anyone please show me how to fix my code in order to get a histogram with Temp as my variable of interest?
library(tidyverse)
just_Temp <- airquality[,"Temp"]
ggplot(just_Temp, aes(x = Temp)) +
  geom_histogram()
#> Error: `data` must be a data frame, or other object coercible by `fortify()`, not an integer vector.
Created on 2021-09-29 by the reprex package (v2.0.1)
Hello R Geeks, i am trying to get a histogram with a comparison of weight and cholesterol levels but I keep getting an error message could someone help me with getting the correct code. See below the error message am getting,
diabetes <- read.csv("https://raw.githubusercontent.com/malcolmbarrett/au-stats412-612-01-reading_data/master/diabetes.csv")
just_height <- diabetes[, "height"]
ggplot(just_height, aes(x = height)) +geom_histogram()
*Error: stat_bin() can only have an x or y aesthetic. Run rlang::last_error() to see where the error occurred.
Thank you for your help.
Help! I am trying to change the intervals of the Y-axis. The graphs are being displayed by increments of 300 making the data challenging to analyze visually. Please let me know if there is a way to improve the visualization of this data.
Thanks,
Samantha
ggplot(diabetes, aes(age , chol)) +
  geom_point()+
  geom_smooth()+
  facet_grid(rows = vars(gender), cols = vars(frame))

#> Error in ggplot(diabetes, aes(age, chol)): could not find function "ggplot"
Created on 2021-09-29 by the reprex package (v2.0.1)
Hello R Community! I could use some help.
I'm trying to create a histogram using the code below; however, I'm getting the below error when attempting to use the ggplot function. Any help you can provide would be greatly appreciated - thanks in advance!
diabetes <- read.csv("https://raw.githubusercontent.com/malcolmbarrett/au-stats412-612-01-reading_data/master/diabetes.csv")
just_height <- diabetes[, "height"]
ggplot(just_height, aes(x = height)) +
  geom_histogram()
#> Error in ggplot(just_height, aes(x = height)): could not find function "ggplot"
Created on 2021-09-29 by the reprex package (v2.0.1)
Hello,
I'm trying to run this code to visualize weight, hip and gender with the diabetes data set using the ggplot2 function. How do I change the code to reflect a bar graph?
ggplot(data = diabetes, mapping = aes(x = weight, y = hip, color = gender)) +
  geom_point()
#> Error in ggplot(data = diabetes, mapping = aes(x = weight, y = hip, color = gender)): could not find function "ggplot"
Thanks,
Sherry
Hi All, I attached some code which has an error and I would like some help on how to correct it. Looks like my ggplot isn't working to make a histogram on diabetes. It says that data should be a data frame and not an integer vector. How do I go about changing that?
library(tidyverse)
diabetes <- read.csv("https://raw.githubusercontent.com/malcolmbarrett/au-stats412-612-01-reading_data/master/diabetes.csv")
just_height <- diabetes[, "height"]
ggplot(just_height, aes(x = height)) +
geom_histogram()
#> Error:datamust be a data frame, or other object coercible byfortify(), not an integer vector.
Hello,
I wanted to create a histogram with the data for average height for women in the US. I first used the code below and it gave me a nice and basic visualization.
library(tidyverse)
library(reprex)
data()
women
ggplot(data = women) +
geom_point(mapping = aes(x = height, y = weight))
However, upon running the code below for the histogram, I get an error and am unable to proceed. Could someone please help me create a histogram with height being the x variable? Thanks so much.
ggplot(women, aes(x = height) +
geom_histogram()
The error I'm getting is this:
geom_bar: na.rm = FALSE, orientation = NA
stat_bin: binwidth = NULL, bins = NULL, na.rm = FALSE, orientation = NA, pad = FALSE
position_stack