Thanks, everyone, for attempting reprexes, and welcome to RStudio Community! If you're still confused about reprexes, please review this week's live session for an in-depth discussion.
Now, to fix the code!
It turns out that the real issue is a quirk of base R. read.csv() returns a regular data frame, and when we try to subset a single column in a data frame, R converts the object to a vector:
x <- data.frame(a = 1:5)

x
#>   a
#> 1 1
#> 2 2
#> 3 3
#> 4 4
#> 5 5

x[, "a"]
#> [1] 1 2 3 4 5

is.data.frame(x[, "a"])
#> [1] FALSE
ggplot() expects a data frame, not a vector. When you're dealing with base R, the solution is to set drop = FALSE, which keeps x as a data frame.
x[, "a", drop = FALSE]
#>   a
#> 1 1
#> 2 2
#> 3 3
#> 4 4
#> 5 5

is.data.frame(x[, "a", drop = FALSE])
#> [1] TRUE
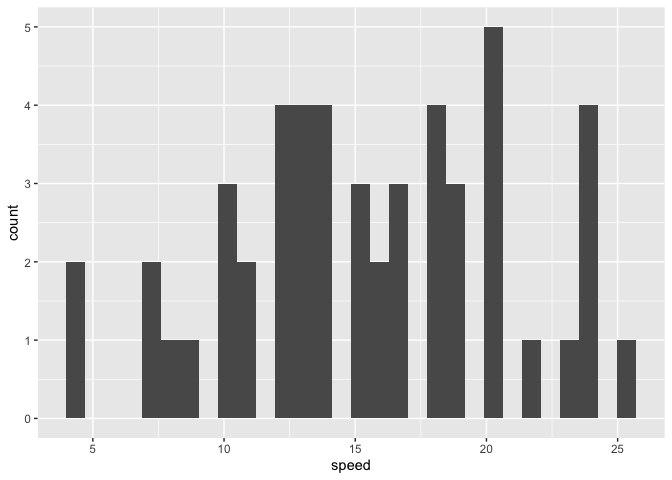
Using this approach will fix our issue. I don't actually need the diabetes dataset here, so instead, I'll use the built-in cars dataset and make a histogram of the speed variable.
library(ggplot2)
just_speed <- cars[, "speed", drop = FALSE]
ggplot(just_speed, aes(x = speed)) +
  geom_histogram()
#> `stat_bin()` using `bins = 30`. Pick better value with `binwidth`.

Notably, the original code used read.csv(), which returns a regular data frame, but readr::read_csv() returns a tibble, a special case of the data frame. Tibbles don't have this behavior, and subsetting them always returns a tibble:
library(tidyverse)
y <- tibble(a = 1:5)
y[, "a"]
#> # A tibble: 5 x 1
#>       a
#>   <int>
#> 1     1
#> 2     2
#> 3     3
#> 4     4
#> 5     5
Using a tibble also solves our problem:
library(tidyverse)
cars <- as_tibble(cars)
just_speed <- cars[, "speed"]
ggplot(just_speed, aes(x = speed)) +
  geom_histogram()
#> `stat_bin()` using `bins = 30`. Pick better value with `binwidth`.

