Hello! long story short, I have a bunch of shinyBS popup and tip objects attached to inputs to give users more information/feedback on what it does in my shiny app.
It works fine locally but they don't render once I push to Rstudio.
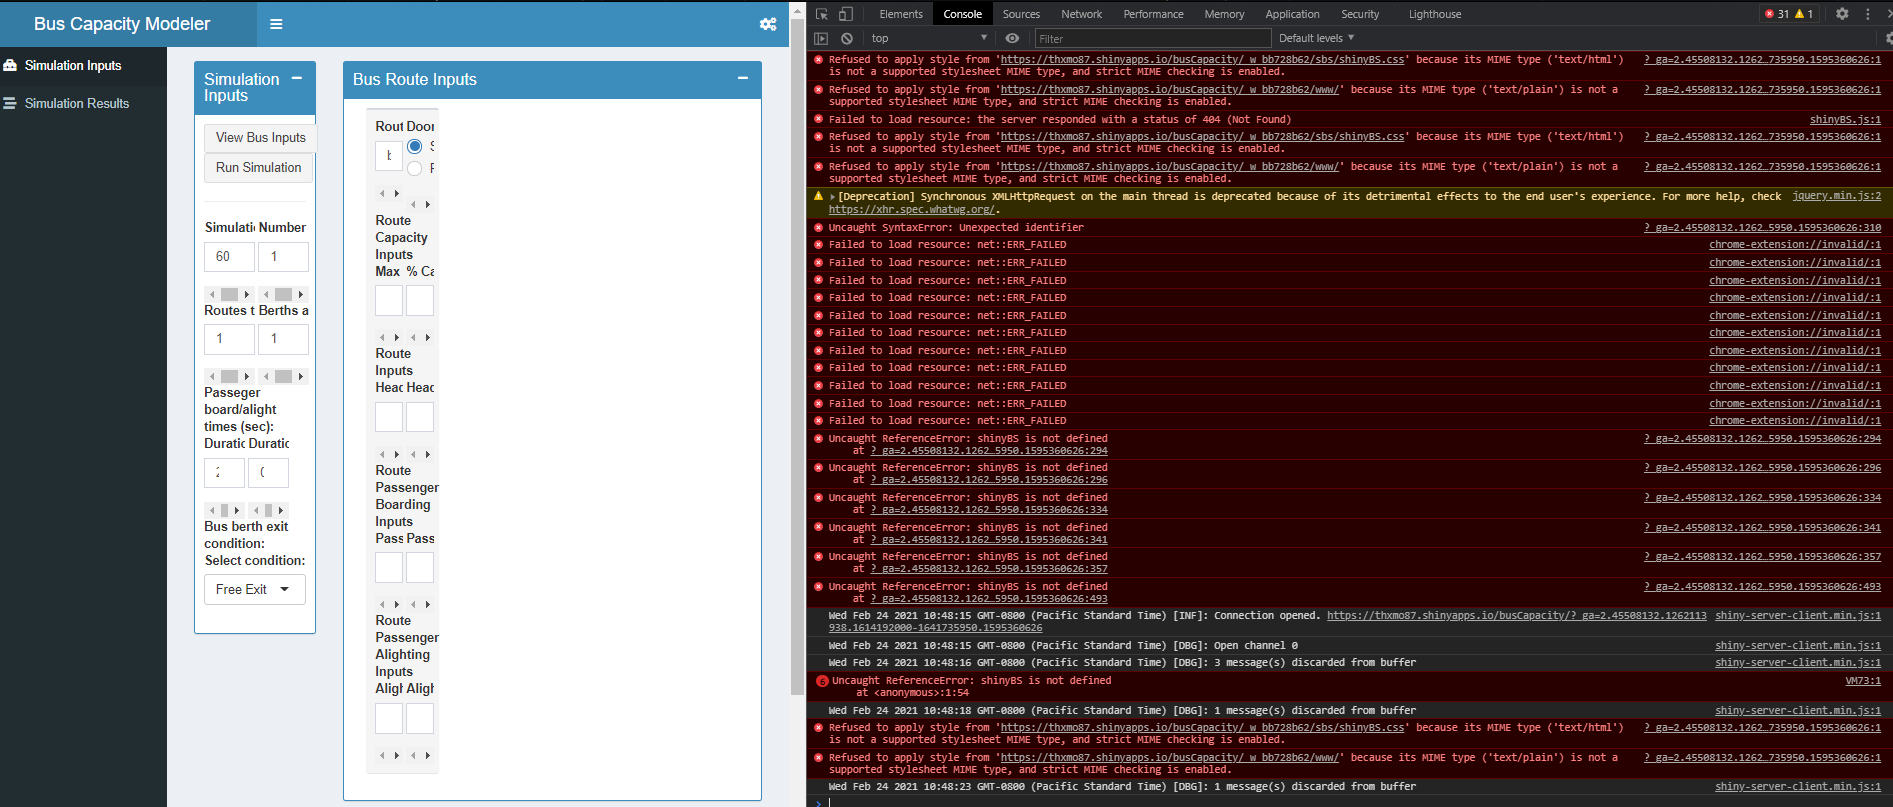
I saw on an old rstudio community post to check out the js on the site (inspect->console ) and it looks like I'm getting a lot of errors relating to shinyBS.css:
Failed to load resource: net::ERR_FAILED
Refused to apply style from 'https://thxmo87.shinyapps.io/busCapacity/_w_bb728b62/sbs/shinyBS.css' because its MIME type ('text/html') is not a supported stylesheet MIME type, and strict MIME checking is enabled.
Uncaught ReferenceError: shinyBS is not defined
But im totally defining the shinyBS in both my desc and in roxygen (using golem framework).
Any ideas????
Also, checked the logs and they were normal - no error messages.
I was able to push a toy application with the following code and I was able to see the shinyBS too:
library(shiny)
library(shinyBS)
shinyApp(
    ui =
        fluidPage(
            sidebarLayout(
                sidebarPanel(
                    sliderInput("bins",
                                "Number of bins:",
                                min = 1,
                                max = 50,
                                value = 30),
                    bsTooltip("bins", "The wait times will be broken into this many equally spaced bins",
                              "right", options = list(container = "body"))
                ),
                mainPanel(
                    plotOutput("distPlot"),
                    uiOutput("uiExample")
                )
            )
        ),
    server =
        function(input, output, session) {
            output$distPlot <- renderPlot({

                # generate bins based on input$bins from ui.R
                x    <- faithful[, 2]
                bins <- seq(min(x), max(x), length.out = input$bins + 1)

                # draw the histogram with the specified number of bins
                hist(x, breaks = bins, col = 'darkgray', border = 'white')

            })
            output$uiExample <- renderUI({
                tags$span(
                    popify(bsButton("pointlessButton", "Button", style = "primary", size = "large"),
                           "A Pointless Button",
                           "This button is <b>pointless</b>. It does not do <em>anything</em>!"),
                    tipify(bsButton("pB2", "Button", style = "inverse", size = "extra-small"),
                           "This button is pointless too!")
                )
            })
            addPopover(session, "distPlot", "Data", content = paste0("<p>Waiting time between ",
                                                                     "eruptions and the duration of the eruption for the Old Faithful geyser ",
                                                                     "in Yellowstone National Park, Wyoming, USA.</p><p>Azzalini, A. and ",
                                                                     "Bowman, A. W. (1990). A look at some data on the Old Faithful geyser. ",
                                                                     "Applied Statistics 39, 357-365.</p>"), trigger = 'click')
        }
)