Shiny: Using multiple exclusive reactiveValues for filtering dataset

Hi.
I am struggling with reactively filtering dataset based on two mutually exclusive conditions (either or). I created a leafet map, where clicking on polygon/marker returns reactiveValues which can be used for filtering dataset for plotting.

If the polygon is clicked, data should be filtered based on region (reactiveValues is a string containing the name of the region). If the marker is clicked, data should be filtered based on single venue (reactiveValues are numerical longitude and latitude values).

I want to use same graphs for showing results for either whole region(which of course contains multiple venues) or single venues. Only thing that came to my mind was to somehow erase/invalidate reactiveValues for region when the venue is selected | erase/invalidate reactiveValues for venue, when the region is clicked.

I'd appreciate every idea.

If I was doing this I would create a compound layer_id in the leaflet object - say prefix it with M for markers and P for polygons - so that I would know from observing the input$map_shape_click event whether a point or polygon was clicked.

Then I would prepare two functions rendering the same chart, one based on a single venue (the marker approach) or some sort of a summary for multiple venues (the polygon approach). Only one would be called, based on testing the first character of input$map_shape_click$id

1 Like

Thanks for a nudge Jindra! Could you specify how should the compound layer_id look like?

Hard to do without having access to your data :frowning:

However, assuming you have a leaflet object consisting of points and polygons, both with an unique column called id, I would consider something along these lines:

leaflet() %>% 
  addProviderTiles("Stamen.Toner") %>% 
  addPolygons(data = polygons, 
              fillColor = "aliceblue", 
              color = "grey",
              layerId = ~paste0("P", polygons$id) %>%  
  addCircleMarkers(data = points, 
                   fillColor = "red", 
                   color = NA,
                   radius = 10,
                   fillOpacity = 1,
                   layerId = ~paste0("M", points$id)

Then, upon observing the input$map_shape_click event I would only need to check the first character of event$id and I would know whether I need to look for detailed data in points data frame or summary data in polygons data frame.

1 Like

Thanks a ton! I'll consider creating reprex for this on some public data and posting it here for posteriority. My dataset is sadly not public.

Well, if no public dataset is available - we will have to make do with our ingenuity, and the good ol' NC shapefile from {sf} package.

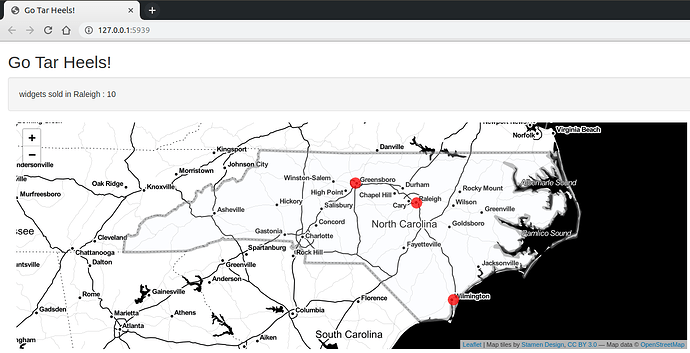
It's a bird? It's a plane! It's the North Carolina shapefile!!!

library(dplyr)
library(shiny)
library(leaflet)
library(sf)

# NC counties - a shapefile shipped with the sf package
shape <- st_read(system.file("shape/nc.shp", package ="sf")) %>% 
    st_transform(shape, crs = 4326) %>% 
    mutate(widgets = 300) %>% # a column of fake data
    group_by(widgets) %>% 
    summarize()


# three cities - note the x and y coordinates
points <- data.frame(name = c("Raleigh", "Greensboro", "Wilmington"),
                     x = c(-78.633333, -79.819444, -77.912222),
                     y = c(35.766667, 36.08, 34.223333),
                     widgets = c(10, 20, 30)) %>% 
    st_as_sf(coords = c("x", "y"), crs = 4326)


# create unique ids for both data sets

shape$uid <- "P1"
points$uid <- paste0("M", 1:3)


# Define UI 
ui <- fluidPage(
    
    # Application title
    titlePanel("Go Tar Heels!"),
    
    
    verticalLayout(
        # Top panel with widgets sold
        wellPanel(
            textOutput("widgets")
        ),
        
        # the map itself
        mainPanel(
            leafletOutput("map")
        )
    )
)

# Define server logic       
server <- function(input, output) {
    
    output$map <- renderLeaflet({
        
        leaflet() %>% 
            addProviderTiles("Stamen.Toner") %>% 
            addPolygons(data = shape, 
                        fillColor = "aliceblue", 
                        color = "grey",
                        layerId = ~uid) %>%  # unique id for polygons
            addCircleMarkers(data = points, 
                             fillColor = "red", 
                             color = NA,
                             radius = 10,
                             fillOpacity = .75,
                             layerId = ~uid)  # unique id for points
    })
    
    # click on polygon
    observe({ 
        
        event <- input$map_shape_click
        
        message <- paste("widgets sold in North Carolina:", shape$widgets[shape$uid == event$id])
        
        output$widgets <- renderText(message)


    })
    # click on a marker
    observe({ 
        
        event <- input$map_marker_click
        
        message <- paste("widgets sold in", points$name[points$uid == event$id],":", points$widgets[points$uid == event$id]) 
        
        output$widgets <- renderText(message)
        
        
    })
}

# Run the application 
shinyApp(ui = ui, server = server)  

Note that since the observed events for a polygon clicked and a marker clicked are separate (which I did not fully realize when writing my earlier post) is is not strictly necessary to do a fancy compounding of layer_id's.
3 Likes

You're a leaflet wizard, Jindra :slight_smile: . Thanks for the code for creating spatial dataframe. Very handy!

Always a pleasure! :slight_smile:

This topic was automatically closed 7 days after the last reply. New replies are no longer allowed.