Shiny app for climate change informed tree species selection
Authors: Bruno Tremblay
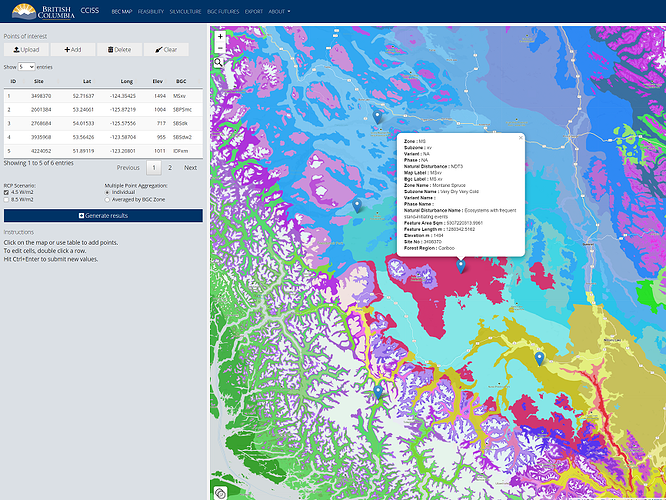
Abstract: Use map or table to enter points of interest. Information for each point is retrieved from a Postgis backend. Click Generate to produce a series of information detailing each site tree species feasibility, including modelled future predictions.
Full Description: This was built for a Code with us BC Gov opportunity.
https://digital.gov.bc.ca/marketplace/opportunities/code-with-us/f9b73f32-ca0d-4009-97b7-6bb04cb91394
The user click on the map or use the table to enter points of interest. Information for each point is fetched live from a Postgis DB. The user can then generate a series of information detailing each site tree species feasibility, including modelled future predictions. Custom SVG are generated from some results. Otherwise it is simple DT or plotly graph. An export option is available to download an HTML report of all sites.
The map uses VectorGrid leaflet extension with custom generated tiles sandwiched between a base layer and labels.
Challenges were:
- Building custom tiles and serving them
- Using VectorGrid with leaflet
- Build an elevation API from raw raster tiles
- Custom SVG factory
Keywords: Government forest management leaflet postgis vectorgrid tileserver
Shiny app: https://neoxone.shinyapps.io/BCGOV_CCISS
Repo: GitHub - bcgov/CCISS_ShinyApp: CCISS RMD knitr report graphics and Shiny App
RStudio Cloud: Posit Cloud
Thumbnail:

Full image:
