Once again - thank you for your thorough response.
I have been reading your code and running it in R (I believe there is a small typetypo for segment B n2s should be n2.vec).
I do have a hard time replicating your results though. I have created the following example script for the above Segment A (the fixed total of 60000):
library(pwr)
library(pwrss)
library(purrr)
library(dplyr)
library(tidyr)
library(ggplot2)
set.seed(42)
# The total sample size available (N)
N_total_segment_size <- 60000
step <- 2
# Create simulated data with n1 / n2 combinations (+/- 2 steps)
sim_data <- tibble::tibble(
total = N_total_segment_size,
n1 = seq(from = (N_total_segment_size - step), to = step, by = -1),
n2 = seq(from = step, to = (N_total_segment_size - step), by = 1),
kappa = (N_total_segment_size / n2) - 1
)
# Run three different power tests over the n1 / n2 values in sim_data
test_results <- sim_data |>
mutate(test_2p2n_arcsin = map2(
# pwr::pwr.2p2n.test (with arcsin tranformation)
n1, n2, \(n1, n2) pwr.2p2n.test(h = ES.h(p1 = 0.014, p2 = 0.009),
n1 = n1,
n2 = n2,
sig.level = 0.05,
power = NULL,
alternative = "greater")),
# pwrss:pwrss::pwrss.z.2props (without arcsin transformation)
test_pwrss_z_2props_no_arcsin = map2(
n2, kappa, \(n2, kappa) pwrss.z.2props(p1 = 0.014, p2 = 0.009,
n2 = n2,
kappa = kappa,
alpha = 0.05,
arcsin.trans = FALSE,
alternative = "greater",
verbose = FALSE)),
# pwrss:pwrss::pwrss.z.2props (with arcsin transformation)
test_pwrss_z_2props_arcsin = map2(
n2, kappa, \(n2, kappa) pwrss.z.2props(p1 = 0.014, p2 = 0.009,
n2 = n2,
kappa = kappa,
alpha = 0.05,
arcsin.trans = TRUE,
alternative = "greater",
verbose = FALSE))
)
# Pick out the power estimate within list structure of each
test_results_power <- test_results |>
mutate(test_2p2n_arcsin_power = purrr::map_dbl(test_2p2n_arcsin, 5),
test_pwrss_z_2props_no_arcsin_power = purrr::map_dbl(test_pwrss_z_2props_no_arcsin, 4),
test_pwrss_z_2props_arcsin_power = purrr::map_dbl(test_pwrss_z_2props_arcsin, 4)) |>
select(n1, n2, kappa, test_2p2n_arcsin_power, test_pwrss_z_2props_no_arcsin_power, test_pwrss_z_2props_arcsin_power)
(annotation_tibble <- test_results_power |>
pivot_longer(
cols = test_2p2n_arcsin_power:test_pwrss_z_2props_arcsin_power,
names_to = "test_function",
values_to = "power") |>
group_by(test_function) |>
filter(power >= 0.8) |>
slice(which.min(power)) |>
mutate(power_min_target = 0.8))
#> # A tibble: 3 × 6
#> # Groups: test_function [3]
#> n1 n2 kappa test_function power power_min_target
#> <dbl> <dbl> <dbl> <chr> <dbl> <dbl>
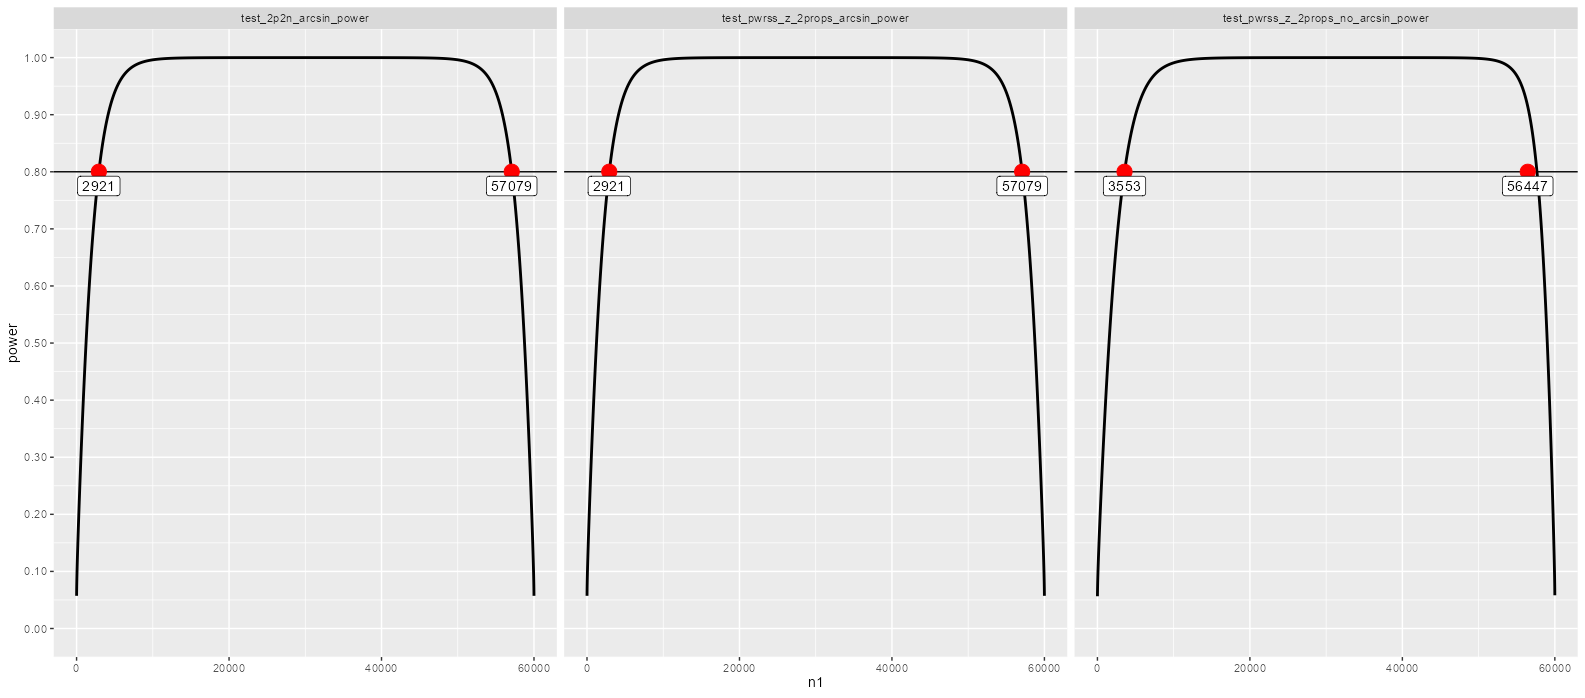
#> 1 57079 2921 19.5 test_2p2n_arcsin_power 0.800 0.8
#> 2 57079 2921 19.5 test_pwrss_z_2props_arcsin_power 0.800 0.8
#> 3 3553 56447 0.0629 test_pwrss_z_2props_no_arcsin_power 0.800 0.8
result_long <- test_results_power |>
pivot_longer(
cols = test_2p2n_arcsin_power:test_pwrss_z_2props_arcsin_power,
names_to = "test_function",
values_to = "power")
result_long |>
ggplot(aes(x = n1, y = power)) +
geom_line(linewidth = 1) +
geom_hline(
data = annotation_tibble,
aes(yintercept = power_min_target)) +
geom_point(
data = annotation_tibble,
mapping = aes(x = n1, y = power),
size = 5,
colour = "red") +
geom_point(
data = annotation_tibble,
mapping = aes(x = n2, y = power),
size = 5,
colour = "red") +
geom_label(
data = annotation_tibble,
aes(x = n1, y = power, label = n1),
nudge_y = -0.025) +
geom_label(
data = annotation_tibble,
aes(x = n2, y = power, label = n2),
nudge_y = -0.025) +
scale_y_continuous(
n.breaks = 10,
labels = scales::number_format(accuracy = 0.01, decimal.mark = "."),
limits = c(0, 1.0)) +
theme(legend.position = "none") +
facet_wrap(~test_function)
Created on 2023-12-14 with reprex v2.0.2
My main questions are:
- Do you understand why there is such a difference in the control / treatment split of sample units?
- What role does the arcsin transformation play in all of this? Do you know of any guidance in terms of what to choose and is a choice between the two dependent on sample size and or effect sizes?
Note, I'm unsure if the above has a small error - the treatment group point for test_pwrss_z_2props_no_arcsin_power is not aligning with the intercept for power = 0.8 and the power curve (the results seem correct when looking at the power test outputs and I believe the error might only be in the way I handle ggplot2) ![]()