Misaligned point in facetted ggplot2 graph

Continuing the discussion from Sample size calculation for two independent proportions.

I was wondering if anyone could see why, in the plot shown in the above post (#5), the point for n2 (56447) in the rightmost facet (test_pwrss_z_2props_no_arcsin_power) is seemingly misaligned? I'm thinking it is because of some interaction with the separate data frame (annotation_tibble) and the facetting, but I'm stumped as to understand where specifically the mistake occurs.

Hi @QueryingQuagga. Looking through the code in the previous post, I do not believe the plot is misaligned. The line graph is created from result_long with x = n1. Inspecting result_long below for the specific n1 and n2 values identified in annotation_tibble, we see that power is actually not at the 0.8 threshold when n1 = 56447 for test_pwrss_z_2props_no_arcsin_power. The plot is actually reflecting the proper power of 0.914. The actual n1 value should be located at 57655.

# key values from annotation_tibble
annotation_tibble |> select(n1, n2, test_function, power)

#> # A tibble: 3 × 4
#> # Groups:   test_function [3]
#>      n1    n2 test_function                       power
#>   <dbl> <dbl> <chr>                               <dbl>
#> 1 57079  2921 test_2p2n_arcsin_power              0.800
#> 2 57079  2921 test_pwrss_z_2props_arcsin_power    0.800
#> 3  3553 56447 test_pwrss_z_2props_no_arcsin_power 0.800

# review these key values in result_long (57655 added to illustrate)
result_long |>
  filter((test_function == 'test_pwrss_z_2props_no_arcsin_power' & n1 %in% c(3553, 56447, 57655)) | 
           (test_function != 'test_pwrss_z_2props_no_arcsin_power' & n1 %in% c(2921, 57079))
         ) |>
  arrange(test_function, n1)

#> # A tibble: 7 × 5
#>      n1    n2   kappa test_function                       power
#>   <dbl> <dbl>   <dbl> <chr>                               <dbl>
#> 1  2921 57079  0.0512 test_2p2n_arcsin_power              0.800
#> 2 57079  2921 19.5    test_2p2n_arcsin_power              0.800

#> 3  2921 57079  0.0512 test_pwrss_z_2props_arcsin_power    0.800
#> 4 57079  2921 19.5    test_pwrss_z_2props_arcsin_power    0.800

#> 5  3553 56447  0.0629 test_pwrss_z_2props_no_arcsin_power 0.800
#> 6 56447  3553 15.9    test_pwrss_z_2props_no_arcsin_power 0.914 *** too high
#> 7 57655  2345 24.6    test_pwrss_z_2props_no_arcsin_power 0.800 

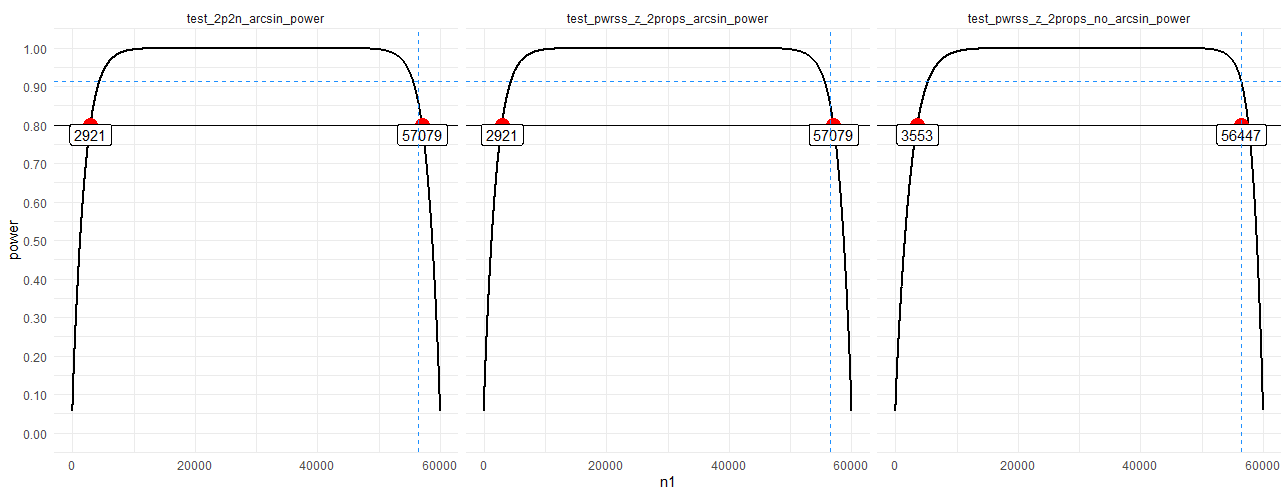
I recreated the plot below and added blue dotted lines at n1 = 56447 and power = 0.914. As shown, the intersection lands squarely on the line in the third faceted plot. Therefore, the plot appears to be rendering accurately.

Created on 2023-12-22 with reprex v2.0.2

1 Like

This topic was automatically closed 7 days after the last reply. New replies are no longer allowed.

If you have a query related to it or one of the replies, start a new topic and refer back with a link.