RStudio doesn't render Plotly plot

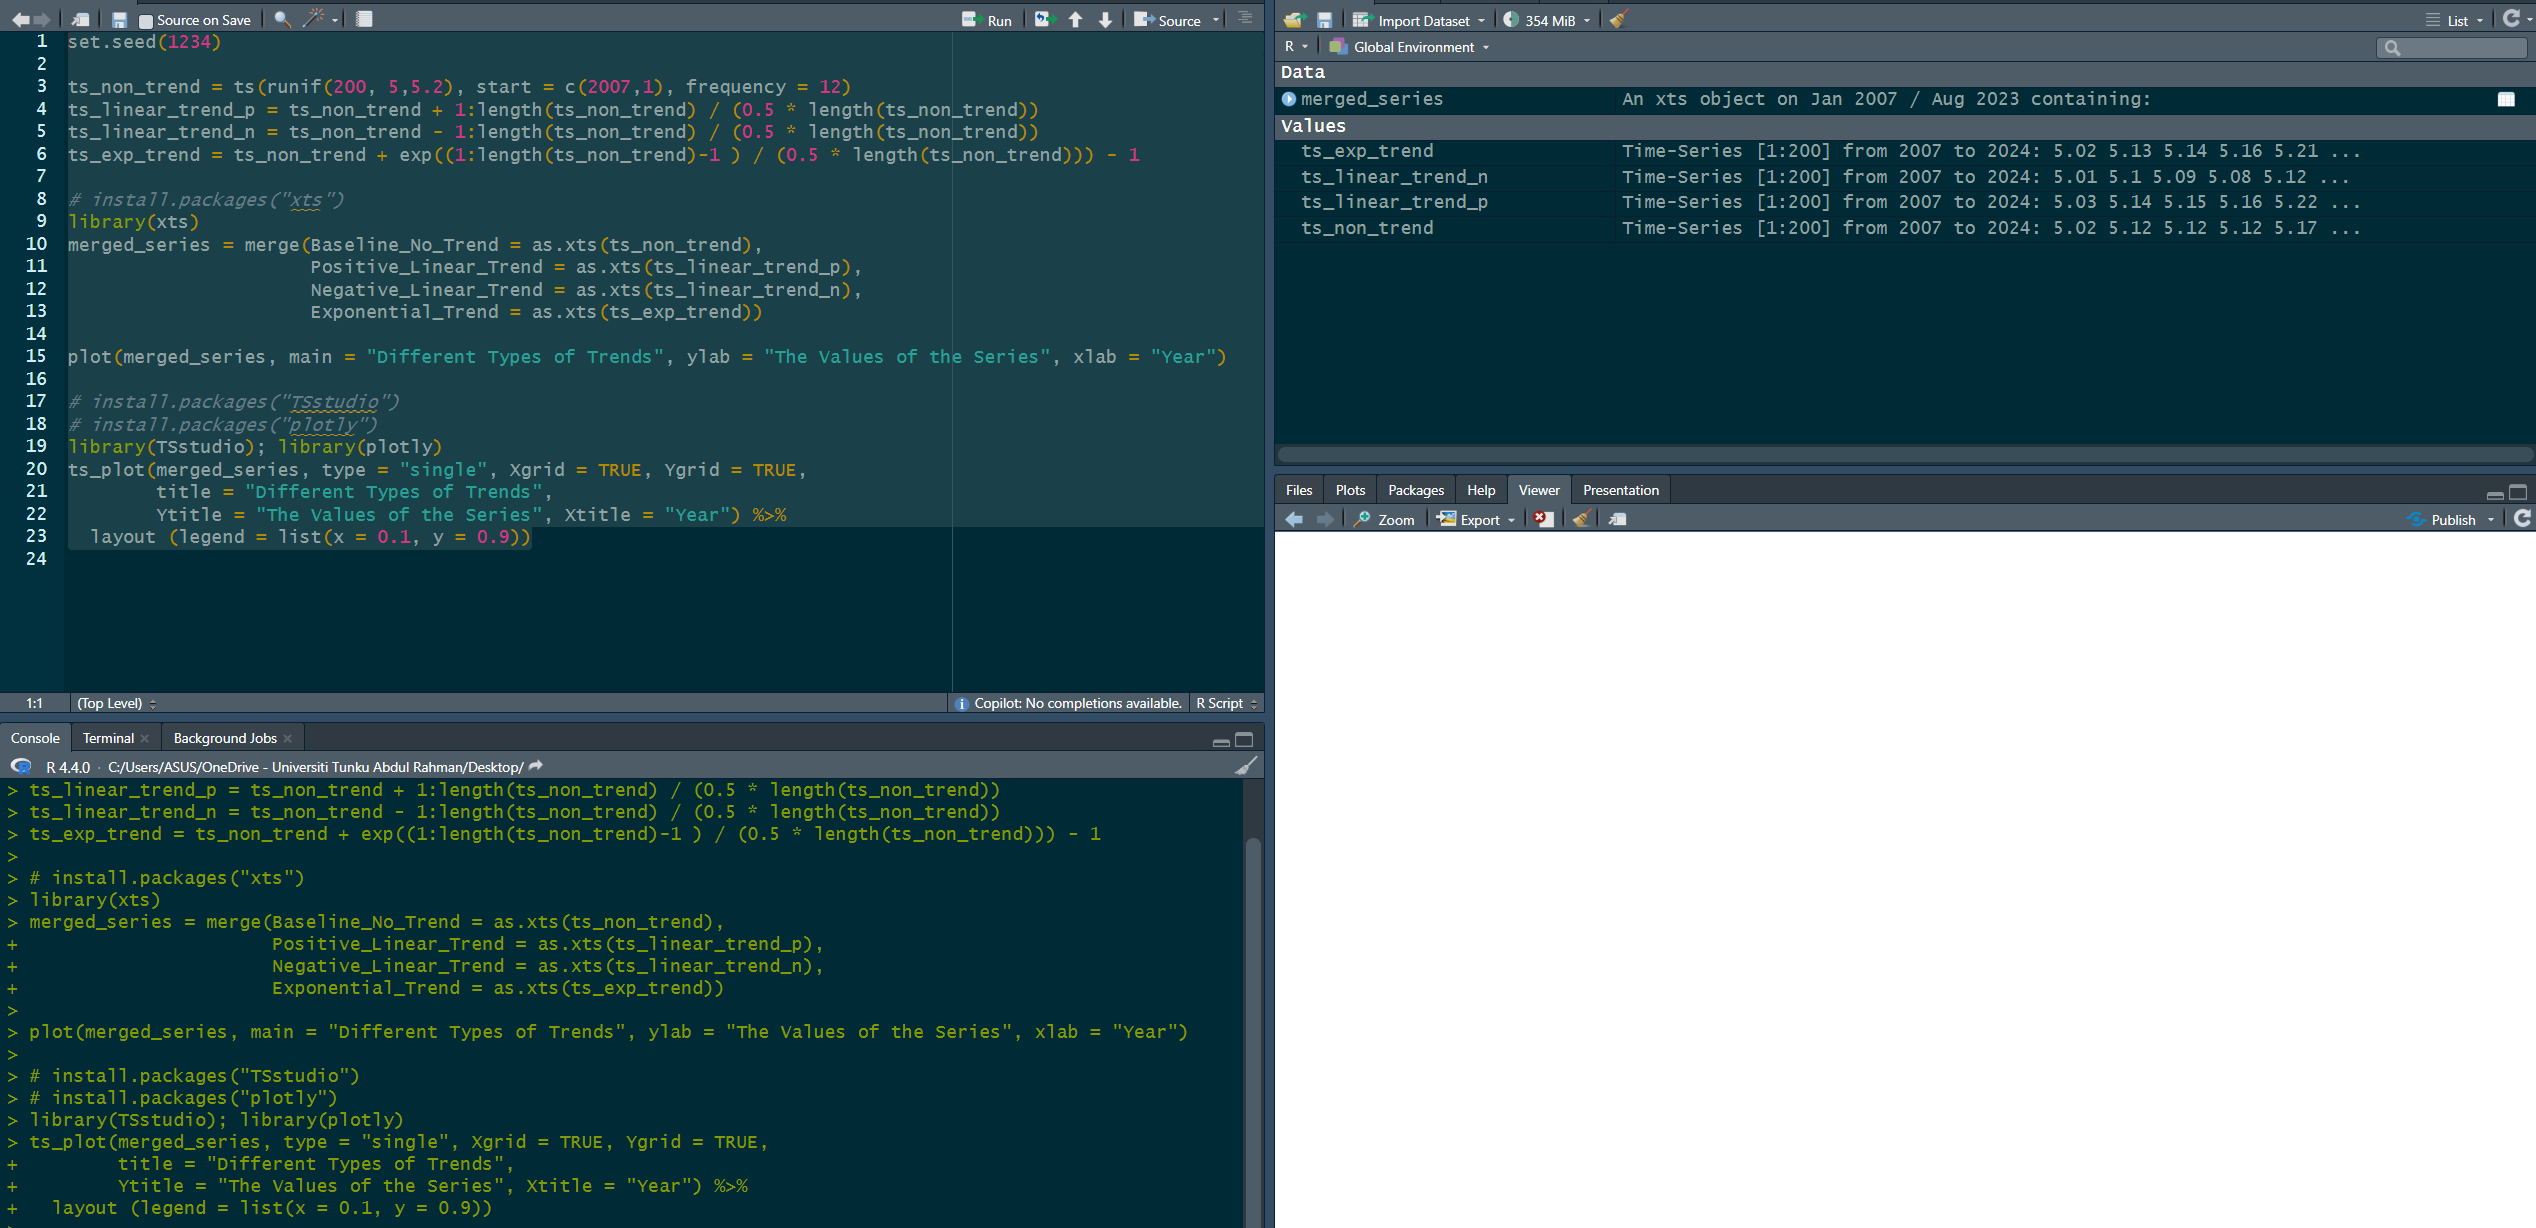
Below are my codes trying to plot something using plotly. After running the codes, the graph is not displayed in the Viewer pane. Check screenshot. Any clue?


set.seed(1234)

ts_non_trend = ts(runif(200, 5,5.2), start = c(2007,1), frequency = 12)
ts_linear_trend_p = ts_non_trend + 1:length(ts_non_trend) / (0.5 * length(ts_non_trend))
ts_linear_trend_n = ts_non_trend - 1:length(ts_non_trend) / (0.5 * length(ts_non_trend))
ts_exp_trend = ts_non_trend + exp((1:length(ts_non_trend)-1 ) / (0.5 * length(ts_non_trend))) - 1

library(xts)
merged_series = merge(Baseline_No_Trend = as.xts(ts_non_trend),
                      Positive_Linear_Trend = as.xts(ts_linear_trend_p),
                      Negative_Linear_Trend = as.xts(ts_linear_trend_n),
                      Exponential_Trend = as.xts(ts_exp_trend))

# plot(merged_series, main = "Different Types of Trends", ylab = "The Values of the Series", xlab = "Year")

library(TSstudio); library(plotly)
ts_plot(merged_series, type = "single", Xgrid = TRUE, Ygrid = TRUE,
        title = "Different Types of Trends",
        Ytitle = "The Values of the Series", Xtitle = "Year") %>% 
  layout (legend = list(x = 0.1, y = 0.9))

Your code works on my end.

> packageVersion("TSstudio")
[1] ‘0.1.7’
> packageVersion("plotly")
[1] ‘4.10.4’

> rstudioapi::versionInfo()$long_version
[1] "2024.04.1+748"

> R.version
               _                           
platform       aarch64-apple-darwin20      
arch           aarch64                     
os             darwin20                    
system         aarch64, darwin20           
status                                     
major          4                           
minor          4.0                         
year           2024                        
month          04                          
day            24                          
svn rev        86474                       
language       R                           
version.string R version 4.4.0 (2024-04-24)
nickname       Puppy Cup     


I have the same version as you for everything (TSstudio, plotly, Rstudio, R). By any chance you know the possible reasons why the plot isn't rendered on my side?

Btw if I use plot() instead of ts_plot(), it works.

This could be a recent Windows issue: see last post in Plotly charts not displaying in RStudio Viewer on Windows

This topic was automatically closed 7 days after the last reply. New replies are no longer allowed.

If you have a query related to it or one of the replies, start a new topic and refer back with a link.