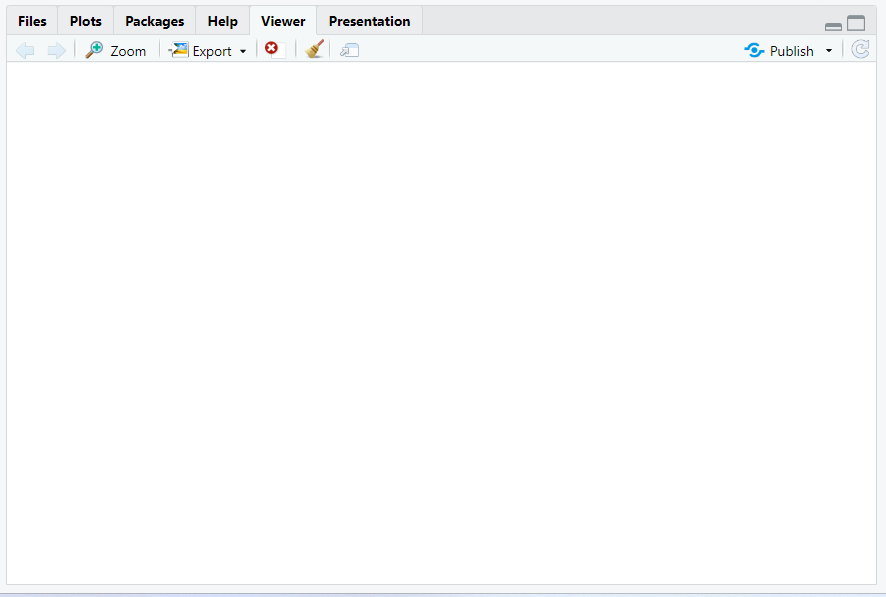
When attempting to view a Plotly chart in the RStudio Viewer on a Windows system, the chart fails to display. Instead, the Viewer shows an empty area. The issue is specific to the RStudio Viewer and does not affect other visualization methods such as saving the chart as an image file or opening it in a web browser.
library(plotly)

mtcars <-
  data.frame(
    mpg = mtcars$mpg,
    disp = mtcars$disp,
    hp = mtcars$hp
    )

p <-
  plot_ly(
    mtcars,
    x = ~disp,
    y = ~mpg,
    type = "bar"
    )
This sounds familiar — did you do a google search to see if it's been addressed?
I used your title in a google search, and got this right away:
opened 06:33PM - 28 Apr 24 UTC
closed 03:59PM - 08 May 24 UTC
bug
windows
external
viewer pane
_Note from @kevinushey: if you're encountering issues with plots and HTML widget… s not displaying in the RStudio Viewer pane with R 4.4.0 on Windows, the issue should be resolved with the latest patch releases of R available at https://cran.r-project.org/bin/windows/base/rpatched.html. Thanks!_
Verify fixed in:
- [x] Patch: 2024.04.1
- [x] Release: 2024.07.0
---
<!--
IMPORTANT: Please fill out this template fully! Failure to do so will result in the issue being closed automatically.
This issue tracker is for bugs and feature requests in the RStudio IDE. If you're having trouble with R itself or an R package, see https://www.r-project.org/help.html, and if you want to ask a question rather than report a bug, go to https://community.rstudio.com/. Finally, if you use RStudio Server Pro, get in touch with Posit Support at support@posit.co.
-->
### System details
RStudio Edition : Desktop
RStudio Version : 2024.04.0+737 Chocolate Cosmos (desktop)
OS Version : Windows 11 x64 (build 22621)
R Version : R version 4.4.0 (2024-04-24 ucrt)
### Steps to reproduce the problem
Windows 11
Install R-4.4.0
Install latest Version of RStudio
```
install.packages("plotly")
plotly::plot_ly(x = rnorm(100), y = rnorm(100), mode = "markers", type = "scatter")
```
### Describe the problem in detail
RStudio Viewer does not function properly on the new R version R-4.4.0 on Windows 11. The Viewer remains blank.
I encountered this issue using RStudio Version 2023.12.1-402, and after updating to the latest build, 2024.04.0+737, the problem persisted.

However, when I ran the same code in the standard R Console, the expected Scatterplot appeared in my default browser.
### Describe the behavior you expected
When reverting to R-4.3.3, everything functions as normal.

<!--
Please keep the below portion in your issue, and check `[x]` the applicable boxes.
-->
- [x] I have read the guide for [submitting good bug reports](https://github.com/rstudio/rstudio/wiki/Writing-Good-Bug-Reports).
- [x] I have installed the latest version of RStudio, and confirmed that the issue still persists.
- [ ] If I am reporting an RStudio crash, I have included a [diagnostics report](https://support.posit.co/hc/en-us/articles/200321257-Running-a-Diagnostics-Report).
- [x] I have done my best to include a minimal, self-contained set of instructions for consistently reproducing the issue.
system
June 14, 2024, 11:00pm
4
This topic was automatically closed 7 days after the last reply. New replies are no longer allowed.