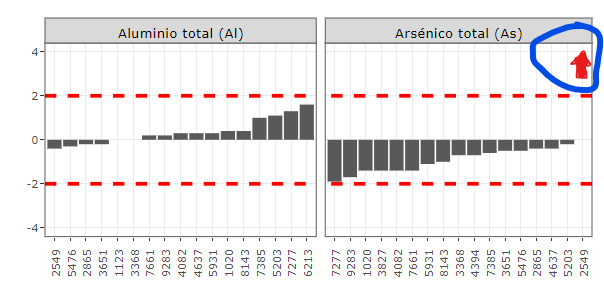
I have a chart with a fixed scale using ggplotly. One (or several) of my data is out of scale and ggplotly doesn't show it to me (in fact, I don't want it to show it because otherwise it will leave all my other data out of scale). I need to include a shape (arrow ideally, pointing up or down, as the case may be), that informs the reader that there is an overscaled data. Also, using ggplotly for that graph, when hovering over that arrow, the text I have defined should appear.