I want to keep the the state and it's total vote number together.
I'll be recoding them as either nonrestrictive or restrictive - in terms of current voting legislation so I know which states go where, it's a matter of actually being able to do it.
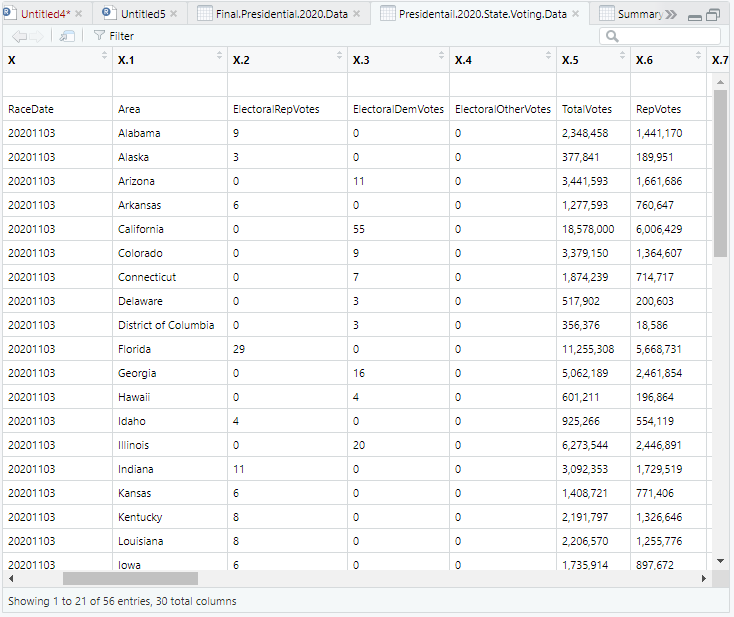
The data are not being read in correctly. The column names are being treated as part of the data. The column names should be RaceDate, Area, etc instead of X, X.1 etc. Please show the code you are using to read in the data.
I downloaded the dataset from the following website
https://library-cqpress-com.turing.library.northwestern.edu/elections/download-data.php
In R, I just imported the dataset (from base)
That link is asking me for a user id and password. What command was used for "I just imported the data set (from base)"?
When opening a new r studio script, you have the 4 quadrants (top left where you type the commands), (top right you have environment, history, connections, tutorial), (bottom left you have the console/output), and (bottom right is the help dialog).
In top left quadrant, under the environment tab, there's an option for importing datasets. I saved it to my computer as a .csv straight from the website. 
Assuming you have a column named Restrict with 1 for Restrictive or 2 for Nonrestrictive,
df1 <- df[df$Restrict == 1, ]
df2 <- df[df$Restrict == 2, ]
I don't yet but thank you!
OK, that means you are using the read.csv() function. You should see that in the console (lower left pane) when you import the data. It looks like you have to modify that to skip at least one line. The command you currently see should be something like
President.2020.State.Voting.Data <- read.csv("President.2020.State.Voting.Data.csv")
Try changing that to
President.2020.State.Voting.Data <- read.csv("President.2020.State.Voting.Data.csv ", skip = 1)
That will skip the first line in the file. You should be able to look at the file with a plain text editor, like Notepad, and see how many lines you need to skip.
I looked back at the original file and there was a title "Presidential 2020 Data" 2 rows above the columns so I just removed it. The column names are now correct!
You can now make a column to label the states has restrictive or not. First make a vector with the names of the states that are restrictive. I'll make a list of three
Restr <- c("Alaska", "Ohio", "Arizona")
To make a new column with Yes/No labeling:
Presidentail.2020.State.Voting.Data$Restrict <- ifelse( Presidentail.2020.State.Voting.Data$Area %in% Restr, "Yes", "No)
Thank you, just organized!
Because I made a vector of the states that ARE RESTRICTIVE, do I need to do the same and make a separate vector for NONRESTRICTIVE states? or does the new column assume that those that are not labeled restrictive, automatically nonrestrictive?
The code I wrote makes a column named Restrict that has the value Yes if the Area is in the vector of restrictive states and it has the value No if it is not in the vector of restrictive states. Every Area is thus labelled as being in or out of the restrictive group. If there are only two possible kinds of Areas, this column labels for both of them.
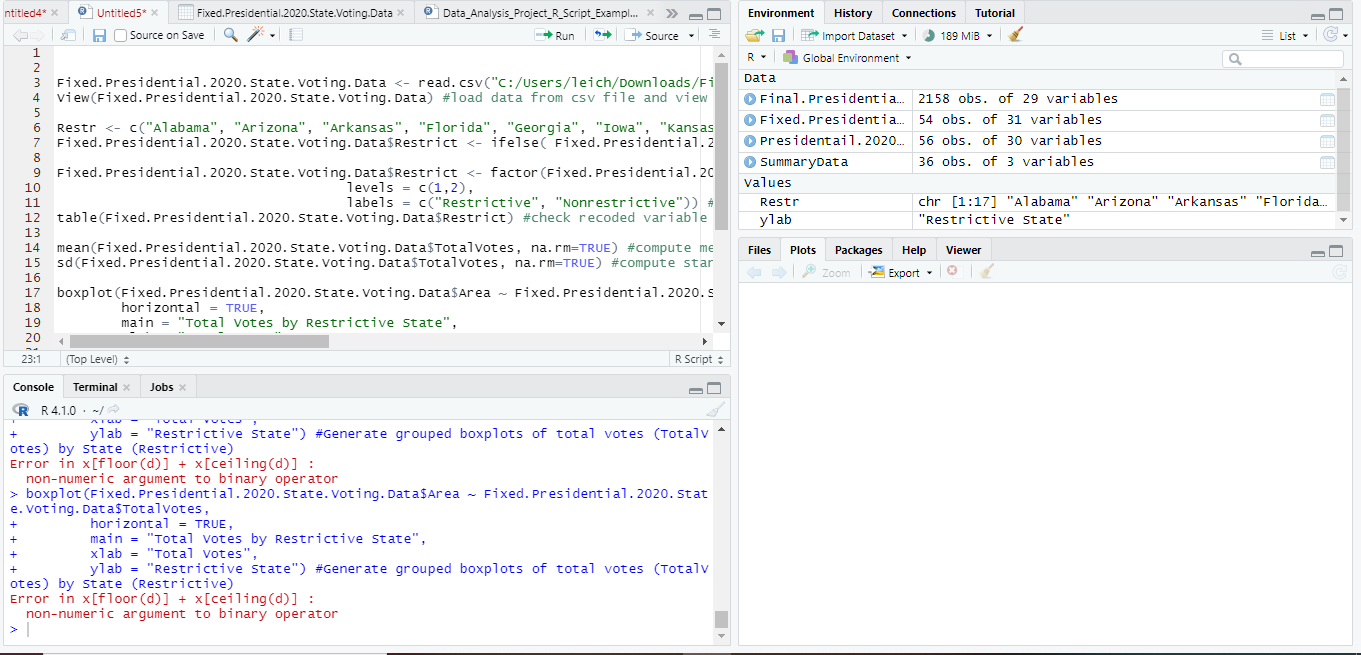
Thank you so much! I've seem to run into another problem. I am trying to run a boxplot to indicate visually the difference between the restrictive and nonrestrictive states and their total voter turnout (TotalVotes) but I keep getting same error message - Error in x[floor(d)] + x[ceiling(d)] :
non-numeric argument to binary operator
Any ideas as to why?
Try using
Presidentail.2020.State.Voting.Data$Votes ~ Presidentail.2020.State.Voting.Data$Area
in your call to boxplot().
This error message popped up.
Error in stats::model.frame.default(formula = Fixed.Presidential.2020.State.Voting.Data$Votes ~ :
invalid type (NULL) for variable 'Fixed.Presidential.2020.State.Voting.Data$Votes'

Apparently there is not a column named Votes. Looking at a previous image, I am guessing that it is called TotalVotes. In any case, use the name of the column storing the number of votes.
boxplot(Fixed.Presidential.2020.State.Voting.Data$TotalVotes ~ Fixed.Presidential.2020.State.Voting.Data$Area,
-
horizontal = TRUE, -
main = "Total Votes by Restrictive State", -
xlab = "Total Votes", -
ylab = "Restrictive State") #Generate grouped boxplots of total votes (TotalVotes) by State (Restrictive)
Error in x[floor(d)] + x[ceiling(d)] :
non-numeric argument to binary operator
Still getting the error
Looking at your original image, It looks like TotalVotes has commas as the thousands separator. This will cause the values to be read as characters. You can check this with the str() function which shows, among other things, the type of data in each column. Is TotalVotes of the type chr or num?
str(Fixed.Presidential.2020.State.Voting.Data$TotalVotes)
If it is of the type chr, you can fix that with the parse_number function from the readr package.
library(readr)
Fixed.Presidential.2020.State.Voting.Data$TotalVotes <- parse_number(Fixed.Presidential.2020.State.Voting.Data$TotalVotes)
Finally, I am not sure a box plot makes sense for your data. Does each Area only appear once in the data set? If so, a boxplot is not appropriate. A bar plot would be better, using barplot() or the ggplot2 package.