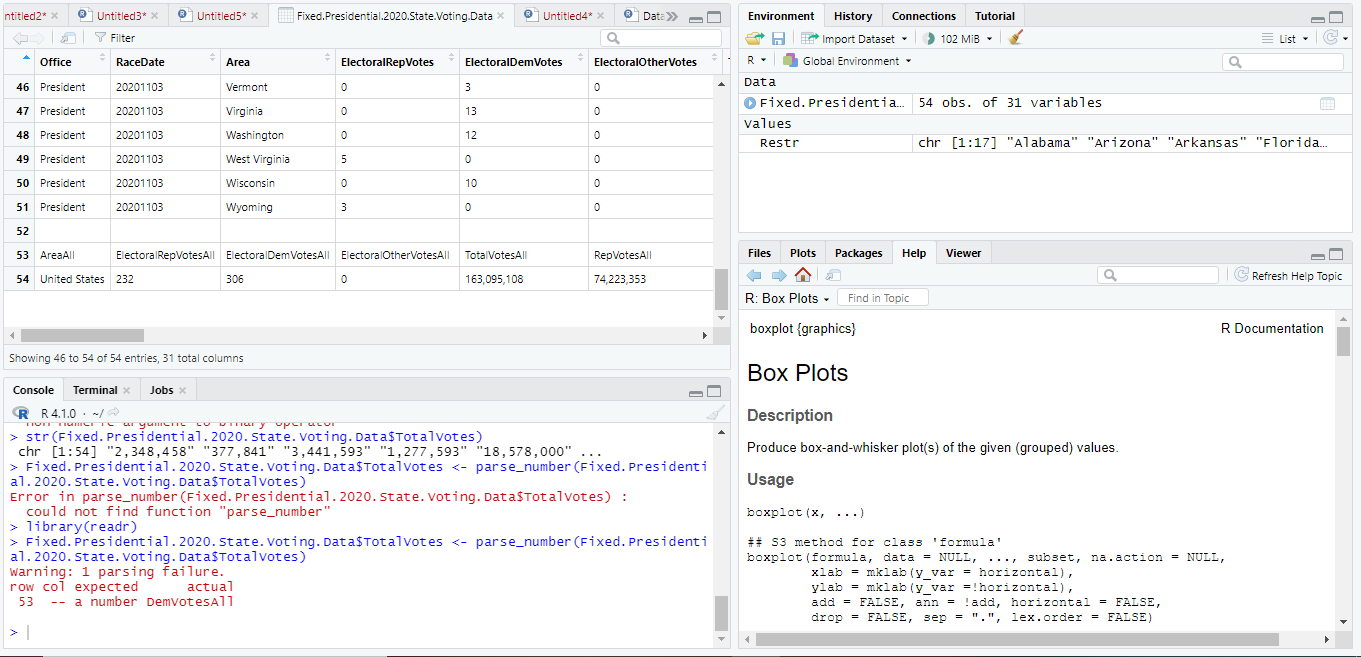
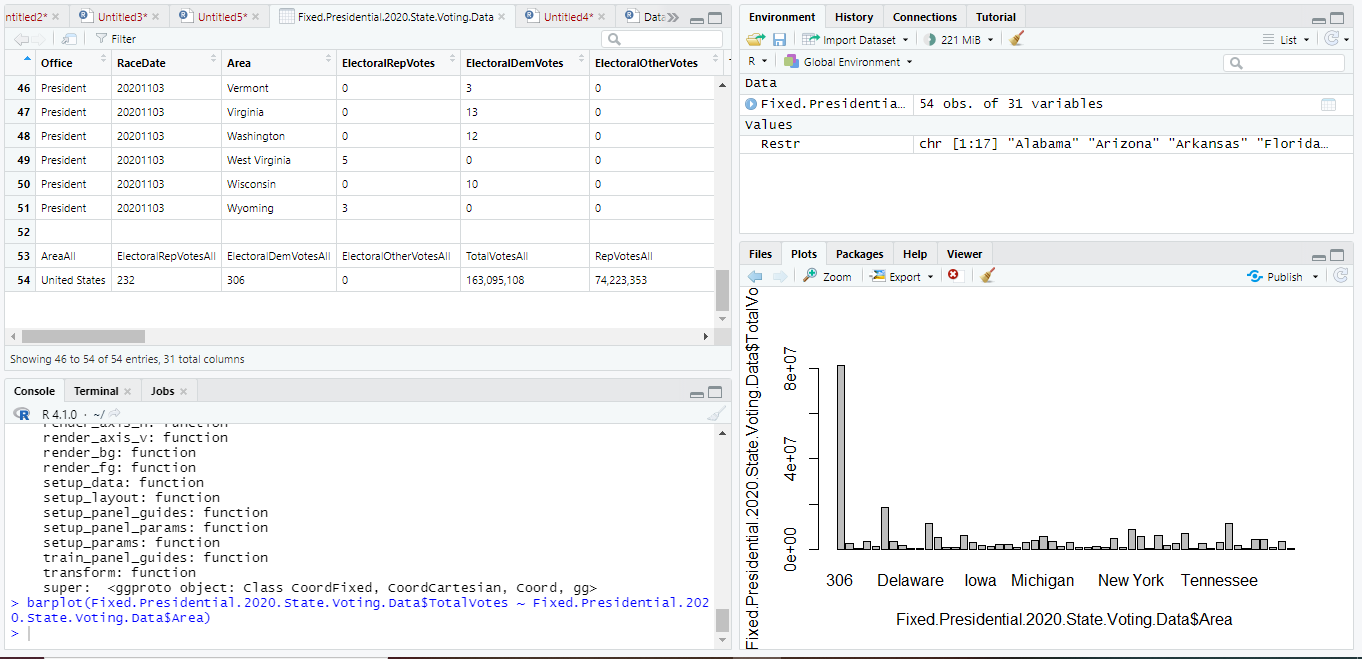
You may have to convert all of the columns that contain numeric data using parse_number(), as I showed before. The presence of those headings in row 53 probably forced everything to be characters. You can then make your plots using the StateData data frame.
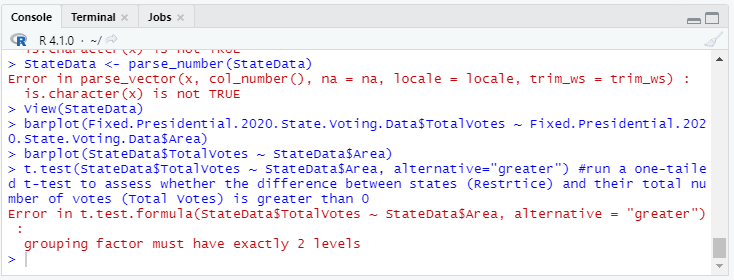
You are using the t.test() incorrectly. You are running StateData$TotalVotes against StateData$Area. The Area column probably has 51 levels, the 50 states plus D.C., unless it is different from what I have seen in your images. As the error message says, the grouping factor should have two levels. You ask about states categorized as restrictive and nonrestrictive but I do not see how your t.test could tell which states are which; it is just looking at the two columns TotalVotes and Area. It might make sense to run the t test on TotalVotes and the column that labels states as restrictive and nonrestrictive, but I have strong doubts about that.
What is the question you are trying to answer? Is it whether more absolute votes were cast in states with restrictive or nonrestrictive policies? That will be very strongly affected by the populations of the states. Your result might well be effectively the same as asking whether the populations of restrictive and nonrestrictive states are different, which seems like an odd question. And I doubt that those populations are distributed anything like normally.
I ended up doing t.test(StateData$TotalVotes ~ StateData$Restrict) which had provided me with the figures I think I need (df, t value, p-value, I also installed the "lsr" package and ran a cohen
s d test to determine the magnitude of the relationship between states with and without restrictive policies.