Is there a way to evaluate training errors within the CV process in tidymodels? I could natively evaluate and plot validation errors' curves, but not with the training error. Having both on the same charts is extremely useful for understanding how to improve my model from the design point of view.
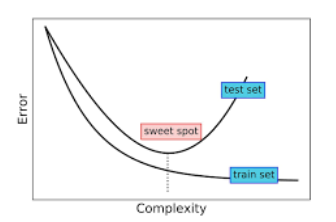
The only procedure I can imagine is to go by hand, excluding all the advantages of using the tune_grid capabilities. Conversely, I am just starting with tidy models, which could be perfectly reasonable. I have not found the right way to do it. I try to recreate the classical complexity/error charts with both training and validation curves to highlight the U-shape and the training's overfitting with the ability to compare the progression of both curves together.
Thank you everyone for the support,
Max
February 13, 2024, 3:00pm
2
This is the type of operation where we feel that it can have some benefit it but we don't offer high-level syntax to do it. We are worried about beginners misusing it (intentional or not - I've seen both).
That doesn't mean that you can do it though. You can extract anything from the results using the extract argument to the control functions. Here's an example:
library(tidymodels)
tidymodels_prefer()
theme_set(theme_bw())
options(pillar.advice = FALSE, pillar.min_title_chars = Inf)
data(ames)
ames$Sale_Price <- log10(ames$Sale_Price)

set.seed(131)
ames_split <- initial_split(ames)
ames_train <- training(ames_split)
ames_test  <- testing(ames_split)
ames_rs <- vfold_cv(ames_train)

# At each resample and tuning parameter combination, get predictions. 'x' will be the fitted
# workflow.
get_train_pred <- function(x) {
  augment(x, ames_train)
}

cart_spec <- decision_tree(cost_complexity = tune()) %>% set_mode("regression")

ctrl <- control_grid(extract = get_train_pred)

set.seed(472)
res <-
  cart_spec %>%
  tune_grid(
    Sale_Price ~ .,
    resamples = ames_rs,
    control = ctrl,
    grid = 15)

collect_extracts(res)
#> # A tibble: 150 × 4
#>    id     cost_complexity .extracts             .config
#>    <chr>            <dbl> <list>                <chr>
#>  1 Fold01        7.11e- 5 <tibble [2,197 × 76]> Preprocessor1_Model01
#>  2 Fold01        6.80e-10 <tibble [2,197 × 76]> Preprocessor1_Model02
#>  3 Fold01        1.93e- 7 <tibble [2,197 × 76]> Preprocessor1_Model03
#>  4 Fold01        3.09e- 8 <tibble [2,197 × 76]> Preprocessor1_Model04
#>  5 Fold01        8.94e- 7 <tibble [2,197 × 76]> Preprocessor1_Model05
#>  6 Fold01        3.85e- 2 <tibble [2,197 × 76]> Preprocessor1_Model06
#>  7 Fold01        1.59e- 9 <tibble [2,197 × 76]> Preprocessor1_Model07
#>  8 Fold01        2.35e- 6 <tibble [2,197 × 76]> Preprocessor1_Model08
#>  9 Fold01        4.97e- 4 <tibble [2,197 × 76]> Preprocessor1_Model09
#> 10 Fold01        1.25e- 8 <tibble [2,197 × 76]> Preprocessor1_Model10
#> # ℹ 140 more rows

# Lots of redundant results so let's do:

collect_extracts(res) %>%
  filter(id == "Fold01") %>%
  select(cost_complexity, .extracts) %>%
  unnest(cols = .extracts) %>%
  group_by(cost_complexity) %>%
  rmse(Sale_Price, .pred) %>%
  ggplot(aes(cost_complexity, .estimate)) +
  geom_point() +
  geom_line() +
  scale_x_log10()
Created on 2024-02-13 with reprex v2.0.2
This gets a lot more complex for a model like glmnet (that has a lot of other complications) so let us know what you of model you are using and we'll know if your task is as straightforward as this one.
If I am not wrong, in your solution, the evaluation will be done on the whole train and validation, and not separately.
library(tidymodels)

tidymodels_prefer()
theme_set(theme_bw())
options(pillar.advice = FALSE, pillar.min_title_chars = Inf)


# custom functions ------------------------------------------------

update_full_metrics <- function(res) {
  res |>
    dplyr::mutate(
      .metrics = id |>
        purrr::map(~ full_metrics_fold(res, .x))
    )
}

full_metrics_fold <- function(res, .id = res[["id"]], verbose = TRUE) {
  .id = match.arg(.id)
  if (verbose) message("processing id: ", .id)

  fold <- res |>
    dplyr::filter(id == .id)

  train_ids <- fold[["splits"]][[1]][["in_id"]]

  train_pred <- fold |>
    # filter(res) drops its class and attrs, so collect_extracts fails
    tidyr::unnest(cols = .extracts) |>
    tidyr::unnest(cols = .extracts) |>
    dplyr::filter(
      dplyr::row_number() %in% train_ids,
      .by = cost_complexity
    )

  train_rmse <- train_pred |>
    dplyr::group_by(cost_complexity) |>
    yardstick::rmse(Sale_Price, .pred) |>
    dplyr::mutate(cv_set = "train")

  train_rsq <- train_pred |>
    dplyr::group_by(cost_complexity) |>
    yardstick::rsq(Sale_Price, .pred) |>
    dplyr::mutate(cv_set = "train")

  # cannot use collect_metrics because it returns the cv ones
  validation_metrics <- fold[[".metrics"]][[1]] |>
    dplyr::mutate(cv_set = "validation")

  dplyr::bind_rows(train_rmse, train_rsq, validation_metrics)
}


# workflow --------------------------------------------------------


data(ames)
ames$Sale_Price <- log10(ames$Sale_Price)

set.seed(131)
ames_split <- initial_split(ames)
ames_train <- training(ames_split)
ames_test  <- testing(ames_split)
ames_rs <- vfold_cv(ames_train)

# At each resample and tuning parameter combination, get predictions.
# 'x' will be the fitted
# workflow.
get_train_pred <- function(x) {
  augment(x, ames_train)
}

cart_spec <- decision_tree(cost_complexity = tune()) %>%
  set_mode("regression")

ctrl <- control_grid(extract = get_train_pred)

set.seed(472)
res <-
  cart_spec %>%
  tune_grid(
    Sale_Price ~ .,
    resamples = ames_rs,
    control = ctrl,
    grid = 15)


# learning curves -------------------------------------------------


res_full <- res |>
  update_full_metrics()
#> processing id: Fold01
#> processing id: Fold02
#> processing id: Fold03
#> processing id: Fold04
#> processing id: Fold05
#> processing id: Fold06
#> processing id: Fold07
#> processing id: Fold08
#> processing id: Fold09
#> processing id: Fold10

res_full |>
  unnest(cols = .metrics) |>
  ggplot(aes(cost_complexity, .estimate, color = cv_set)) +
  geom_point() +
  # keep insights from variability
  geom_line(aes(group = paste0(id, cv_set, sep = "-"))) +
  scale_x_log10() +
  facet_grid(.metric~., scales = "free_y")
Created on 2024-02-15 with reprex v2.1.0
I am still a beginner/explorer in tidymodels
Is the solution correct as it appears to me? (Maybe I have wrongly understood the indexing structure or the base for the already evaluated metrics)
What would be the suggested tidymodels way to obtain that?
Thank you!!
system
March 7, 2024, 12:27pm
4
This topic was automatically closed 21 days after the last reply. New replies are no longer allowed.