I'm looking for suggestions/advice on how to plot two categorical (but somewhat numeric...) values. The predictor, x, is a 5 point Likert type scale where score 1 is just 1-2 binned together and y is the outcome of a test performed (not shown).
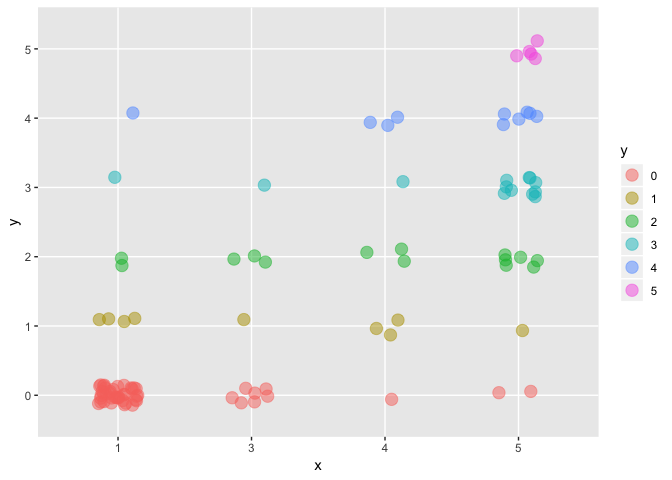
It feels like the result is more obvious in Plot 2, but I'm not sure if using a scatterplot for this type of data is "acceptable"? Does anyone have a suggestion on how I could plot this instead of a barchart?
I had a look at https://www.data-to-viz.com, but I'm none the wizer...
library(tidyverse)
Df <- tibble::tribble(
~x, ~y,
4, 2,
1, 1,
3, 2,
1, 0,
1, 0,
3, 0,
5, 2,
5, 4,
3, 2,
3, 0,
5, 2,
4, 3,
1, 0,
4, 1,
1, 0,
1, 0,
4, 1,
3, 0,
5, 3,
1, 0,
1, 0,
1, 0,
1, 0,
4, 0,
1, 0,
1, 0,
5, 5,
1, 0,
5, 0,
3, 3,
1, 2,
4, 2,
1, 0,
5, 5,
4, 4,
5, 4,
3, 0,
1, 0,
1, 0,
4, 4,
1, 0,
1, 0,
5, 4,
1, 0,
1, 1,
5, 3,
5, 4,
5, 5,
1, 4,
5, 3,
1, 0,
1, 0,
5, 1,
1, 0,
1, 0,
4, 4,
1, 0,
1, 0,
1, 0,
5, 3,
5, 2,
1, 0,
1, 0,
1, 1,
5, 3,
1, 0,
5, 4,
1, 2,
3, 1,
1, 0,
1, 0,
1, 0,
5, 3,
1, 0,
1, 0,
5, 5,
1, 1,
1, 0,
5, 3,
1, 0,
5, 2,
1, 0,
4, 1,
5, 3,
3, 0,
3, 0,
1, 0,
5, 2,
1, 3,
5, 2,
5, 5,
5, 3,
3, 2,
1, 0,
4, 2,
5, 3,
5, 4,
3, 0,
1, 0,
5, 0
) %>%
mutate_if(is.numeric, factor)
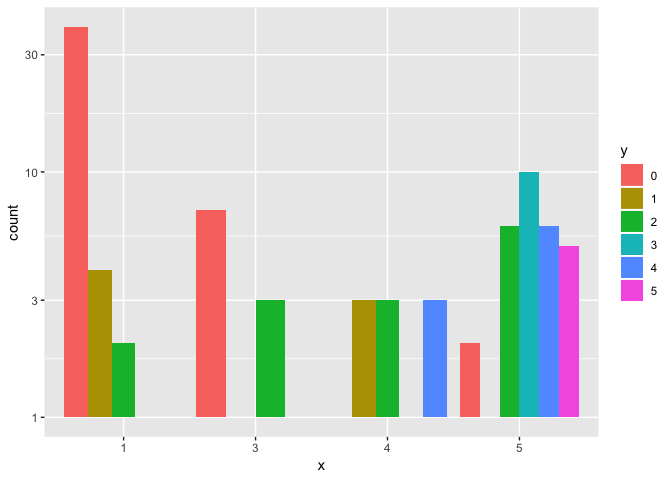
#Plot 1
Df %>%
ggplot(aes(x)) +
geom_bar(aes(fill = y), position = "dodge") +
scale_y_log10()
#Plot 2
Df %>%
  ggplot(aes(x, y)) +
  geom_jitter(aes(color = y), height = 0.15, width = 0.15, size = 4, alpha = 0.5)
Created on 2019-03-04 by the reprex package (v0.2.1)