Sort of a followup to plot suggestions for two categorical vars while trying out geom_count.
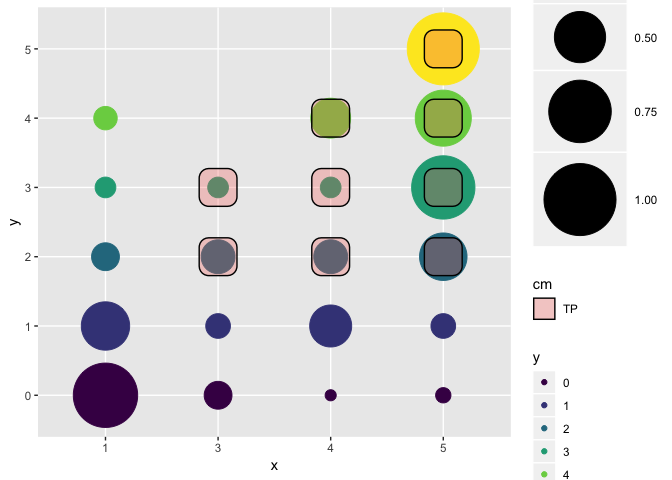
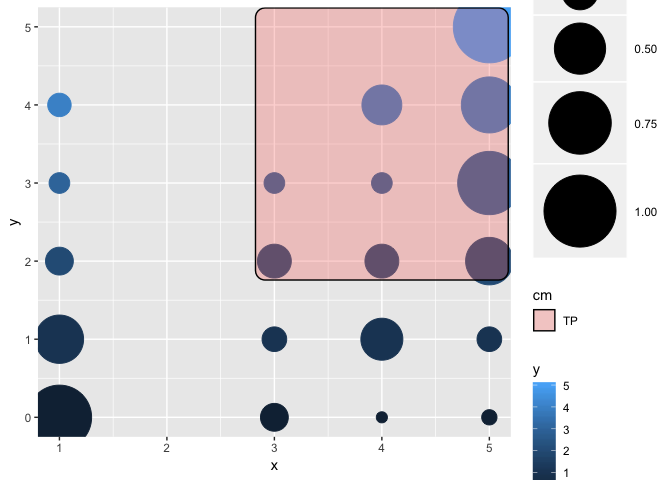
Is there a way to make ggforce ignore factors when using geom_mark()? I'd like to highlight certain areas of the plot, not the individual points. Replacing factors with numeric kind of messes up the ggplot part of the plot.
Edit: @thomasp85, I hope you don't mind me tagging you here.
library(tidyverse)
library(ggforce)
#>
#> Attaching package: 'ggforce'
#> The following objects are masked from 'package:ggplot2':
#>
#> stat_ellipse, StatEllipse
Df <- tibble::tribble(
~x, ~y,
4, 2,
1, 1,
3, 2,
1, 0,
1, 0,
3, 0,
5, 2,
5, 4,
3, 2,
3, 0,
5, 2,
4, 3,
1, 0,
4, 1,
1, 0,
1, 0,
4, 1,
3, 0,
5, 3,
1, 0,
1, 0,
1, 0,
1, 0,
4, 0,
1, 0,
1, 0,
5, 5,
1, 0,
5, 0,
3, 3,
1, 2,
4, 2,
1, 0,
5, 5,
4, 4,
5, 4,
3, 0,
1, 0,
1, 0,
4, 4,
1, 0,
1, 0,
5, 4,
1, 0,
1, 1,
5, 3,
5, 4,
5, 5,
1, 4,
5, 3,
1, 0,
1, 0,
5, 1,
1, 0,
1, 0,
4, 4,
1, 0,
1, 0,
1, 0,
5, 3,
5, 2,
1, 0,
1, 0,
1, 1,
5, 3,
1, 0,
5, 4,
1, 2,
3, 1,
1, 0,
1, 0,
1, 0,
5, 3,
1, 0,
1, 0,
5, 5,
1, 1,
1, 0,
5, 3,
1, 0,
5, 2,
1, 0,
4, 1,
5, 3,
3, 0,
3, 0,
1, 0,
5, 2,
1, 3,
5, 2,
5, 5,
5, 3,
3, 2,
1, 0,
4, 2,
5, 3,
5, 4,
3, 0,
1, 0,
5, 0
) %>%
mutate_if(is.numeric, ordered) %>%
mutate(cm = case_when(
x >= 3 & y >= 2 ~ "TP",
x == 1 & y <= 1 ~ "TN"
))
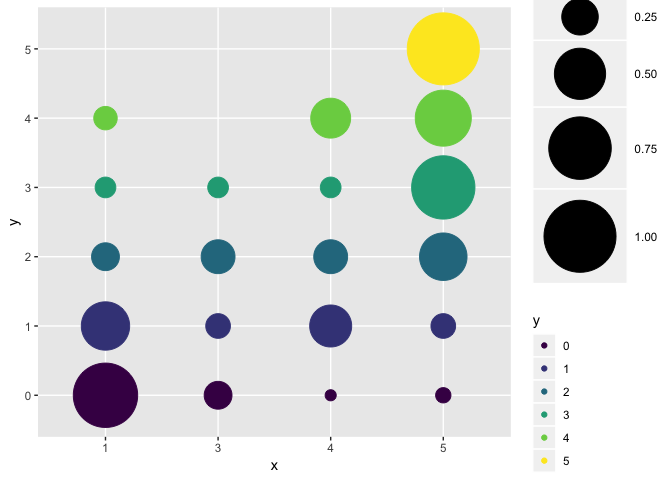
ggplot(Df, aes(x, y)) +
geom_count(aes(color = y, size = stat(prop), group = y)) +
scale_size_area(max_size = 25)
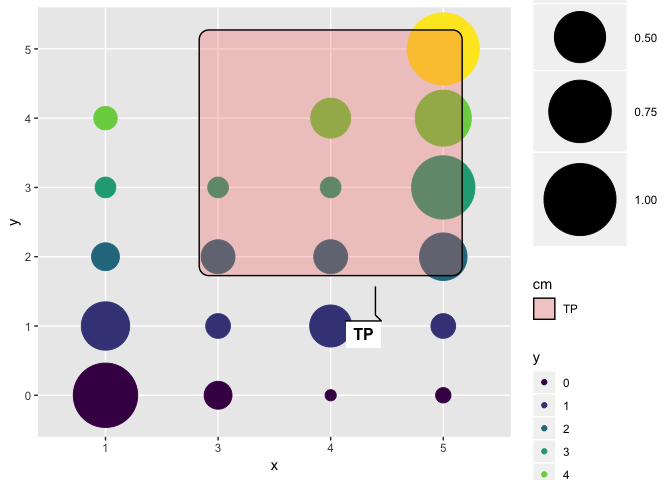
ggplot(Df, aes(x, y)) +
  geom_count(aes(color = y, size = stat(prop), group = y)) +
  scale_size_area(max_size = 25) +
  geom_mark_rect(aes(fill = cm, filter = cm == "TP"))
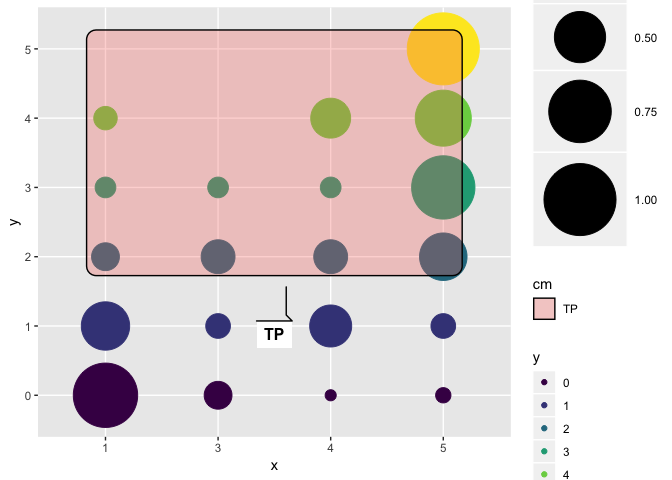
Df %>%
  mutate(x = as.numeric(as.character(x)),
         y = as.numeric(as.character(y))) %>%
  ggplot(aes(x, y)) +
    geom_count(aes(color = y, size = stat(prop), group = y)) +
    scale_size_area(max_size = 25) +
    geom_mark_rect(aes(fill = cm, filter = cm == "TP"))
Created on 2019-03-04 by the reprex package (v0.2.1)