SDHY
1
Hi
Im new to R and hope to get help to change the colors to grey.
Fig2 <- d2 %>%
group_by(name, value) %>%
summarise(count = n()) %>%
mutate(perc = count/sum(count))
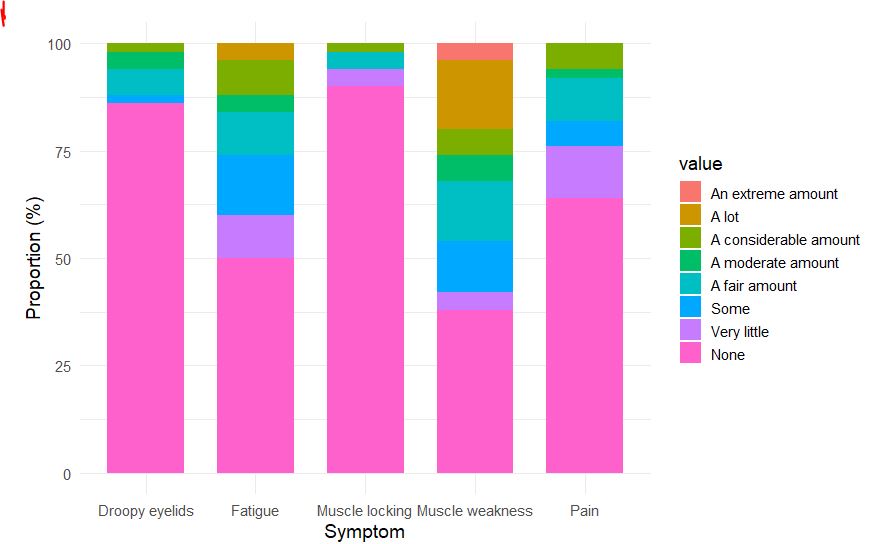
ggplot(Fig2, aes(x = factor(name), y = perc*100, fill = factor(value))) +
geom_bar(stat="identity", width = 0.7) +
labs(x = "Symptom", y = "Proportion (%)", fill = "value") +
theme_minimal(base_size = 14) +
scale_fill_discrete(labels = c('An extreme amount', 'A lot', 'A considerable amount',
'A moderate amount','A fair amount', 'Some', 'Very little', 'None' ))
Thank you
Regards
AlexisW
2
What do you mean, you want the categories to be encoded as shades of grey? Then you can simply use a grey fill scale.
Can't test without a reprex, but maybe something like that:
library(tidyverse)

Fig2 <- tibble(name = LETTERS[1:5] |> rep(8),
               perc = runif(5*8, 0, 1),
               value = c('An extreme amount', 'A lot', 'A considerable amount',
                         'A moderate amount','A fair amount', 'Some', 'Very little', 'None' ) |>
                 rep(5))

ggplot(Fig2, aes(x = factor(name), y = perc*100, fill = factor(value))) +
  geom_bar(stat="identity", width = 0.7) +
  labs(x = "Symptom", y = "Proportion (%)", fill = "value") +
  theme_minimal(base_size = 14) +
  scale_fill_grey(labels = c('An extreme amount', 'A lot', 'A considerable amount',
                                 'A moderate amount','A fair amount', 'Some',
                                 'Very little', 'None' ))

Created on 2023-11-10 with reprex v2.0.2
note only shades of grey will be hard to distinguish for so many categories. I suggested some alternatives here, maybe they can help.
system
Closed
4
This topic was automatically closed 42 days after the last reply. New replies are no longer allowed.
If you have a query related to it or one of the replies, start a new topic and refer back with a link.