When I am generating output from an R Markdown document, I often want to output a table of numbers.
The suggestions for formatting tables in the Markdown cheatsheet all seem to be geared at model-output or statistical result-type tables. That's not what I need.
What I am looking for is a "presentation-friendly" table. More of a business application.
Something that makes it easy to define the format of each column (decimal places, commas, % signs, date formats, etc.) and that lets me define the borders (existence, size, colour) and shading of the tables and its cells. And the width of the table.
A typical example would be a table with 4 columns: Year/Quarter, Count, Amount, Percentage Change. Like 4-12 rows of data.
Does such a thing exist? Does anyone else have this problem, or is it just me? My current painful workaround is to copy the r output to the clipboard, paste into Excel, run a macro to format everything (or do it manually), save that as an image, then link the image into the Rmd file. Ick.
 did a demo specifically on table-making packages (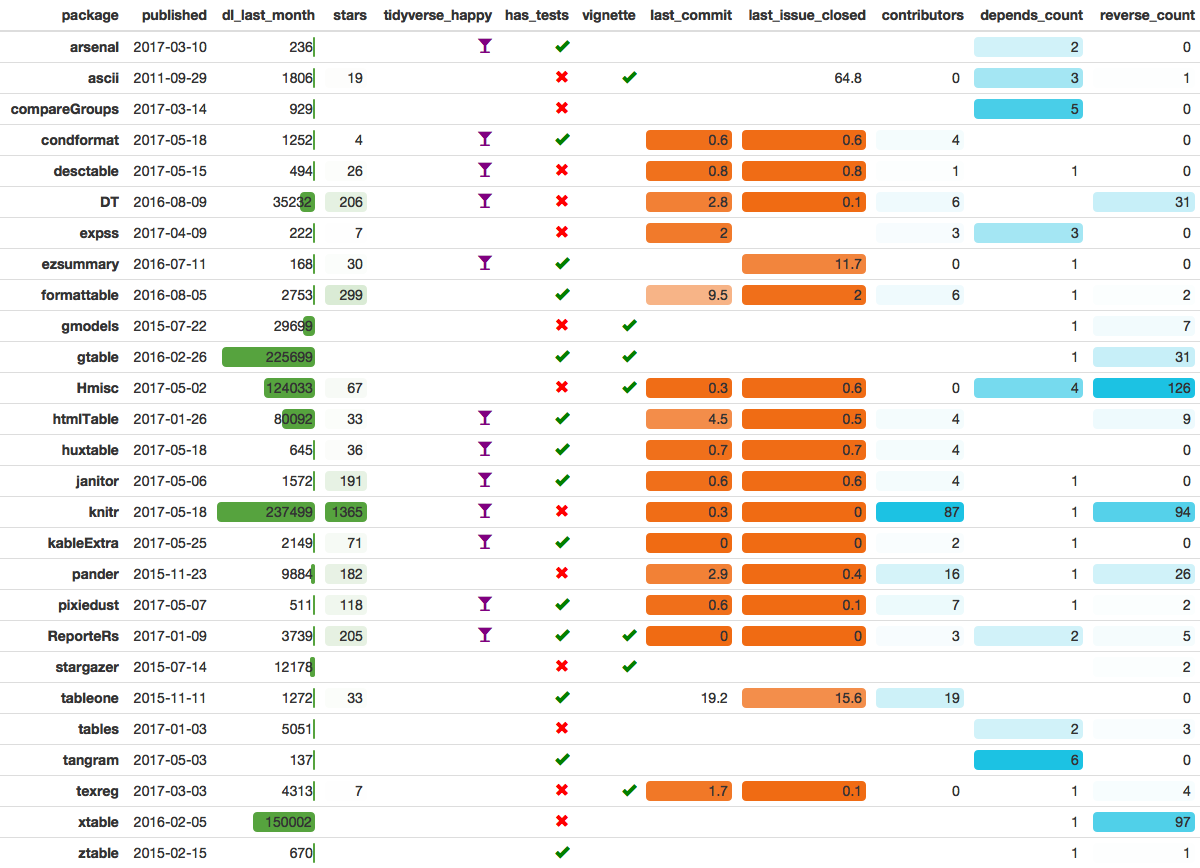
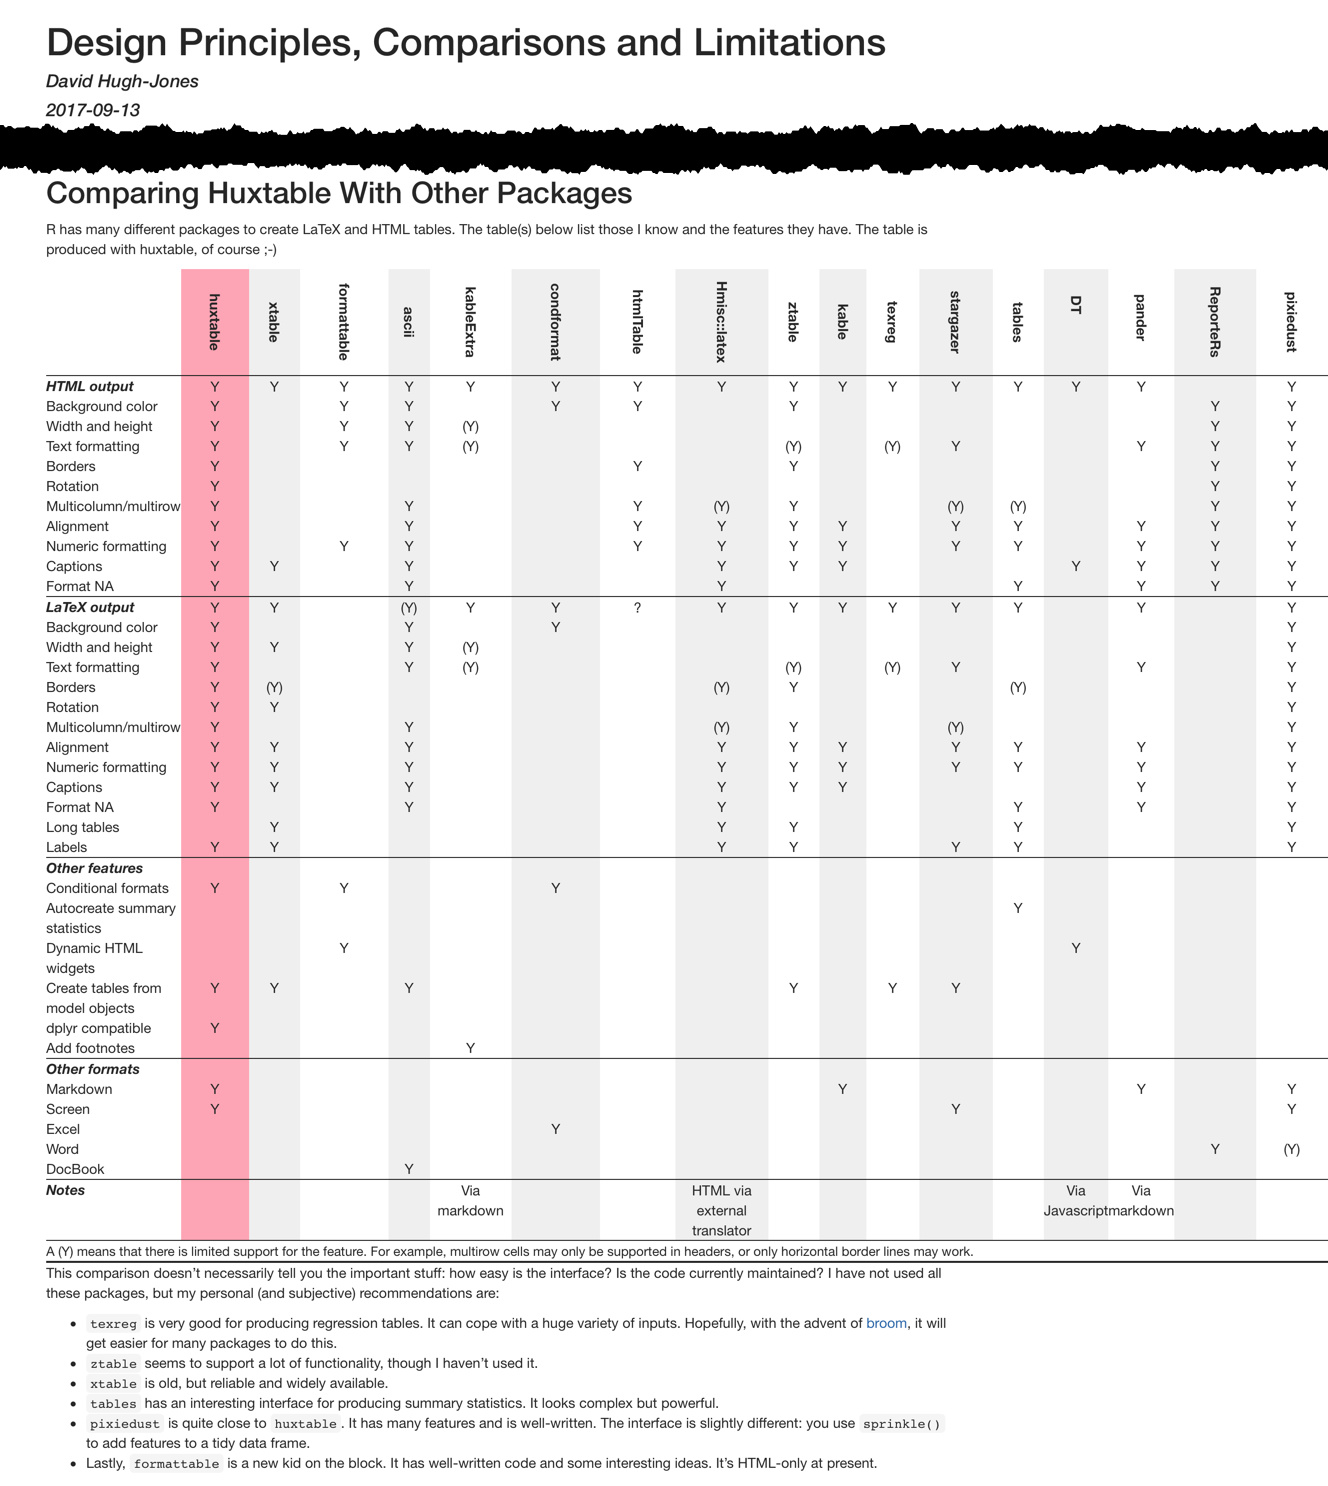
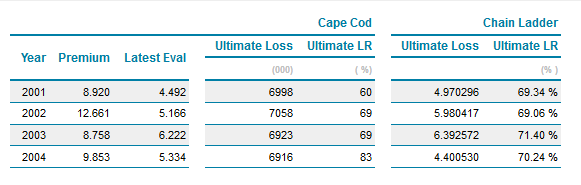

 If you know which features it has, though, I'm sure a PR would get things up to speed more quickly.