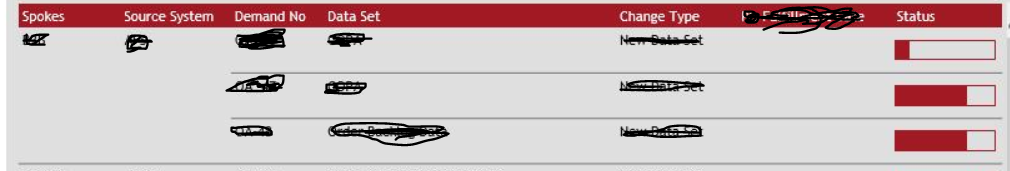
Please refer the attached screenshot to understand my query.
Status column ( in the screenshot ) is row level data and i want to show it in as a graph where as remaining columns are grid type.
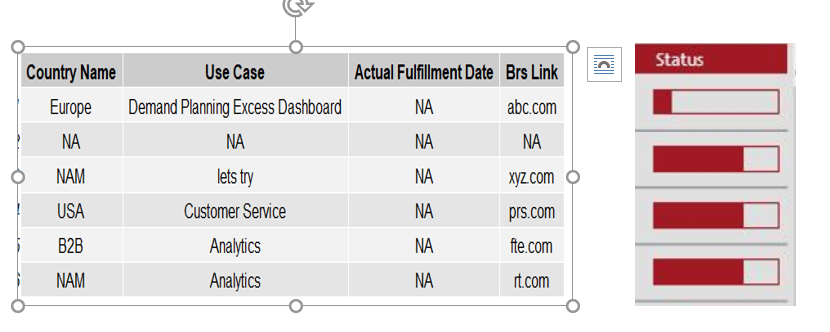
I want to display in the same way as it is present in the picture.
Sorry I don't understand what you mean, could you make a minimal REPRoducible EXample (reprex)? A reprex makes it much easier for others to understand your issue and figure out how to help.
If you've never heard of a reprex before, you might want to start by reading this FAQ:
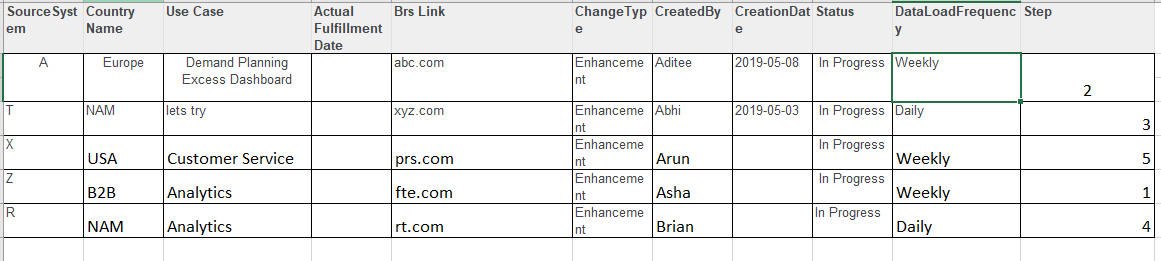
So if you open it, i want the data of column B,C,D, E in grid form and column k ("step") data as a graph and it should display row wise.
There are 5 value for column "K and accordingly graph should look like.
Please note the no. of row in excel is not constant and will change everytime. So if a new row is coming,accordingly graph data along with grid data should appear.
Please let me know if it is possible with R?
I am attaching data set screenshot here and will attach Requirement image separately as it is not allowing to attach 2 image.
Please read the link I gave you before and provide a proper reproducible example or at least sample data on a copy/paste friendly format, screenshots are not very useful for this.