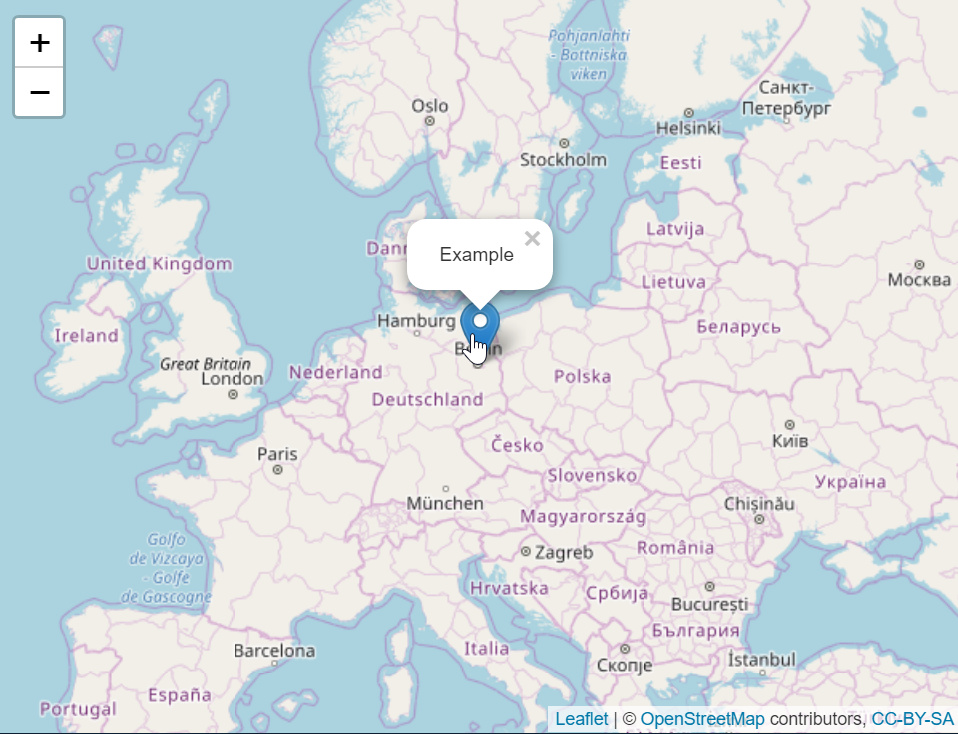
I am trying to make a network analysis and I want the different nodes to be placed in their respective countries. I am unsure of how to create a map in R and I have tried different forums. All of these talk about a "getMap" function, but it does not work in R studio (it says it cannot find the function) and I cannot find the correct package for the function.
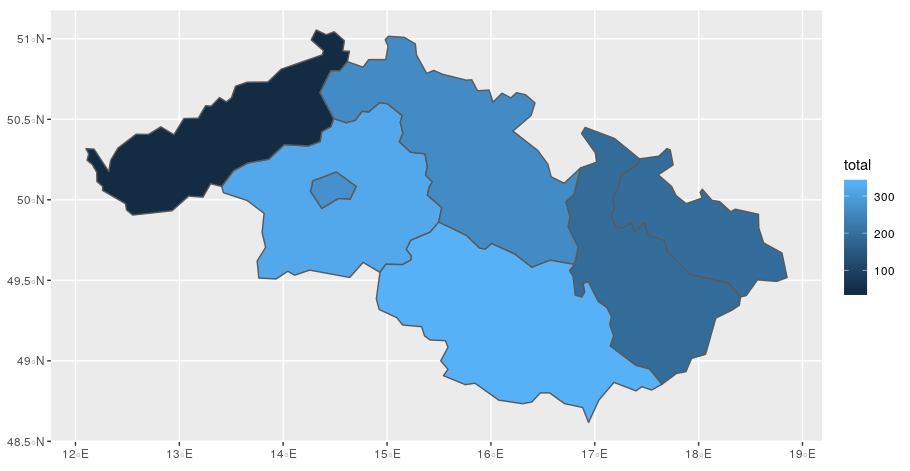
This map is going to show the connectivity between different regions in Europe. The strength of this link is going to be compared to the quality and quantity of patents (number of unique words vs. total number of words in patents)
My dataset looks like this: The region being the leftmost column, then unique words, total words, diversity of words (the ratio of unique to total words) and region name.
Hope somebody can help me with this!
AT12 180 600 0,3 Niederösterreich
AT13 106 141 0,75177305 Wien
AT21 99 353 0,280453258 Kärnten
AT22 337 972 0,346707819 Steiermark
AT31 699 2745 0,254644809 Oberösterreich
AT32 108 236 0,457627119 Salzburg
AT33 241 563 0,428063943 Tirol
AT34 575 2341 0,245621529 Vorarlberg
BE10 126 262 0,480916031 Région de Bruxelles-Capitale / Brussels Hoofdstedelijk Gewest
BE21 91 153 0,594771242 Prov. Antwerpen
BE22 249 734 0,339237057 Prov. Limburg (BE)
BE23 186 412 0,451456311 Prov. Oost-Vlaanderen
BE24 144 298 0,483221477 Prov. Vlaams-Brabant
BE25 134 320 0,41875 Prov. West-Vlaanderen
BE31 188 408 0,460784314 Prov. Brabant Wallon
BE32 169 427 0,395784543 Prov. Hainaut
BE33 377 1273 0,296150825 Prov. Liège
BE34 53 122 0,43442623 Prov. Luxembourg (BE)
BE35 101 246 0,410569106 Prov. Namur
BG32 47 70 0,671428571 Severen tsentralen
CZ01 87 272 0,319852941 Praha
CZ02 131 318 0,411949686 Strední Cechy
CZ04 28 41 0,682926829 Severozápad
CZ05 138 259 0,532818533 Severovýchod
CZ06 150 336 0,446428571 Jihovýchod
CZ07 88 190 0,463157895 Strední Morava
CZ08 100 194 0,515463918 Moravskoslezsko
DE11 2239 25168 0,088962174 Stuttgart
DE12 1473 8642 0,170446656 Karlsruhe
DE13 1355 7185 0,188587335 Freiburg
DE14 1568 11161 0,140489203 Tübingen
DE21 1962 18234 0,107601185 Oberbayern
DE22 633 2815 0,224866785 Niederbayern
DE23 473 1609 0,293971411 Oberpfalz
DE24 608 2756 0,220609579 Oberfranken
DE25 907 6085 0,149055053 Mittelfranken
DE26 747 3643 0,205050782 Unterfranken
DE27 1431 9434 0,151685393 Schwaben
DE30 1233 6365 0,193715632 Berlin
DE40 1441 11322 0,127274333 Brandenburg
DE50 563 2023 0,278299555 Bremen
DE60 739 3225 0,229147287 Hamburg
DE71 1380 9084 0,151915456 Darmstadt
DE72 731 2974 0,245796907 Gießen
DE73 543 1935 0,280620155 Kassel
DE80 299 818 0,365525672 Mecklenburg-Vorpommern
DE91 449 1935 0,232041344 Braunschweig
DE92 721 2960 0,243581081 Hannover
DE93 751 3097 0,242492735 Lüneburg
DE94 715 2834 0,252293578 Weser-Ems
DEA1 1657 14400 0,115069444 Düsseldorf
DEA2 1279 9231 0,138554869 Köln
DEA3 568 2165 0,262355658 Münster
DEA4 1034 5255 0,196764986 Detmold
DEA5 1356 8248 0,164403492 Arnsberg
DEB1 790 4198 0,18818485 Koblenz
DEB2 75 108 0,694444444 Trier
DEB3 683 2240 0,304910714 Rheinhessen-Pfalz
DEC0 187 611 0,306055646 Saarland
DED2 736 4416 0,166666667 Dresden
DED4 825 4314 0,19123783 Chemnitz
DED5 414 1217 0,340180772 Leipzig
DEE0 592 2426 0,244023083 Sachsen-Anhalt
DEF0 847 4808 0,176164725 Schleswig-Holstein
DEG0 966 8153 0,118483994 Thüringen
DK01 121 228 0,530701754 Hovedstaden
DK03 143 441 0,324263039 Syddanmark
DK04 177 782 0,226342711 Midtjylland
DK05 144 384 0,375 Nordjylland
ES11 110 174 0,632183908 Galicia
ES12 32 38 0,842105263 Principado de Asturias
ES13 78 117 0,666666667 Cantabria
ES21 757 3022 0,25049636 País Vasco
ES22 285 636 0,448113208 Comunidad Foral de Navarra
ES24 101 306 0,330065359 Aragón
ES30 278 614 0,45276873 Comunidad de Madrid
ES41 28 92 0,304347826 Castilla y León
ES51 530 1267 0,418310971 Cataluña
ES52 257 416 0,617788462 Comunidad Valenciana
ES61 142 206 0,689320388 Andalucía
FI19 253 687 0,368267831 Länsi-Suomi
FI1B 263 603 0,43615257 Helsinki-Uusimaa
FI1C 52 96 0,541666667 Etelä-Suomi
FI1D 52 181 0,287292818 Pohjois- ja Itä-Suomi
FR10 1237 10074 0,122791344 Île de France
FR21 63 93 0,677419355 Champagne-Ardenne
FR22 501 2112 0,237215909 Picardie
FR23 192 297 0,646464646 Haute-Normandie
FR24 385 1517 0,253790376 Centre (FR)
FR25 139 350 0,397142857 Basse-Normandie
FR26 159 392 0,405612245 Bourgogne
FR30 202 559 0,361359571 Nord - Pas-de-Calais
FR41 244 599 0,407345576 Lorraine
FR42 368 1179 0,312128923 Alsace
FR43 196 475 0,412631579 Franche-Comté
FR51 273 716 0,381284916 Pays de la Loire
FR53 72 140 0,514285714 Poitou-Charentes
FR61 66 146 0,452054795 Aquitaine
FR62 429 2058 0,20845481 Midi-Pyrénées
FR71 1245 5797 0,214766258 Rhône-Alpes
FR72 39 60 0,65 Auvergne
FR82 468 1162 0,402753873 Provence-Alpes-Côte d'Azur
HR04 28 224 0,125 Kontinentalna Hrvatska
HU31 107 187 0,572192513 Észak-Magyarország
IE01 72 139 0,517985612 Border, Midland and Western
IE02 74 113 0,654867257 Southern and Eastern
ITC1 927 3441 0,269398431 Piemonte
ITC3 199 343 0,580174927 Liguria
ITC4 1267 6061 0,209041412 Lombardia
ITF1 23 36 0,638888889 Abruzzo
ITF4 89 225 0,395555556 Puglia
ITF6 63 142 0,443661972 Calabria
ITG1 49 89 0,550561798 Sicilia
ITH1 335 886 0,378103837 Provincia Autonoma di Bolzano/Bozen
ITH2 287 888 0,323198198 Provincia Autonoma di Trento
ITH3 830 3414 0,243116579 Veneto
ITH4 255 750 0,34 Friuli-Venezia Giulia
ITH5 1103 5723 0,192731085 Emilia-Romagna
ITI1 399 1166 0,34219554 Toscana
ITI2 168 820 0,204878049 Umbria
ITI3 395 1244 0,317524116 Marche
ITI4 168 327 0,513761468 Lazio
LU00 83 203 0,408866995 Luxemburg
LV00 68 254 0,267716535 Latvija
MT00 35 146 0,239726027 Malta
NL21 198 684 0,289473684 Overijssel
NL22 128 302 0,42384106 Gelderland
NL23 106 206 0,514563107 Flevoland
NL31 76 243 0,312757202 Utrecht
NL32 150 287 0,522648084 Noord-Holland
NL33 405 1152 0,3515625 Zuid-Holland
NL41 278 1026 0,270955166 Noord-Brabant
NL42 215 703 0,305832148 Limburg (NL)
PL12 173 328 0,527439024 Mazowieckie
PL21 151 310 0,487096774 Malopolskie
PL22 374 1109 0,337240757 Slaskie
PL41 55 111 0,495495495 Wielkopolskie
PL43 26 80 0,325 Lubuskie
PL51 153 302 0,506622517 Dolnoslaskie
PT11 239 561 0,426024955 Norte
RO21 42 54 0,777777778 Nord-Est
RO22 54 92 0,586956522 Sud-Est
SE11 461 1248 0,369391026 Stockholm
SE12 725 3328 0,217848558 Östra Mellansverige
SE21 109 212 0,514150943 Småland med öarna
SE22 393 1145 0,343231441 Sydsverige
SE23 383 1212 0,316006601 Västsverige
SE31 1377 9663 0,142502328 Norra Mellansverige
SE32 46 81 0,567901235 Mellersta Norrland
SI03 137 223 0,614349776 Vzhodna Slovenija
SI04 241 765 0,31503268 Zahodna Slovenija
SK01 129 319 0,404388715 Bratislavský kraj
SK02 63 129 0,488372093 Západné Slovensko
UKC1 207 507 0,408284024 Tees Valley and Durham
UKC2 59 137 0,430656934 Northumberland and Tyne and Wear
UKD3 50 101 0,495049505 Greater Manchester
UKD4 223 754 0,295755968 Lancashire
UKD6 24 38 0,631578947 Cheshire
UKD7 39 146 0,267123288 Merseyside
UKE2 84 177 0,474576271 North Yorkshire
UKE3 481 1722 0,279326365 South Yorkshire
UKE4 236 845 0,279289941 West Yorkshire
UKF1 1089 7971 0,136620248 Derbyshire and Nottinghamshire
UKF2 431 1244 0,346463023 Leicestershire, Rutland and Northamptonshire
UKF3 172 531 0,323917137 Lincolnshire
UKG1 118 235 0,50212766 Herefordshire, Worcestershire and Warwickshire
UKG2 201 355 0,566197183 Shropshire and Staffordshire
UKG3 87 181 0,480662983 West Midlands
UKH1 79 152 0,519736842 East Anglia
UKH2 131 200 0,655 Bedfordshire and Hertfordshire
UKH3 27 48 0,5625 Essex
UKI3 43 79 0,544303797 Inner London - West
UKI5 71 150 0,473333333 Outer London - East and North East
UKI7 68 108 0,62962963 Outer London - West and North West
UKJ1 134 338 0,396449704 Berkshire, Buckinghamshire and Oxfordshire
UKJ2 133 326 0,40797546 Surrey, East and West Sussex
UKJ3 181 438 0,413242009 Hampshire and Isle of Wight
UKJ4 71 175 0,405714286 Kent
UKK1 375 922 0,406724512 Gloucestershire, Wiltshire and Bristol/Bath area
UKK2 80 131 0,610687023 Dorset and Somerset
UKK3 35 52 0,673076923 Cornwall and Isles of Scilly
UKK4 33 54 0,611111111 Devon
UKL1 138 303 0,455445545 West Wales and The Valleys
UKL2 135 287 0,470383275 East Wales
UKM2 129 463 0,278617711 Eastern Scotland
UKM3 55 98 0,56122449 South Western Scotland
UKM5 33 80 0,4125 North Eastern Scotland