Hi,
a few comments:
- your
ggplotsyntax is in fact perfectly legit (as illustrated below) sfpackage, like its predecessorsp, is not a package oriented to plotting, but to spatial data manipulation. It introduces a special format - a data.frame extension - that can be used to read and process spatial objects (points, lines, polygons), but drawing of a chart has to be done elsewhere (supposeggplot::geom_sfif you are already familiar withggplot)ggmapprovides interface to the Google and Open Street Map APIs and is aggplotextension, meaning it uses the same syntax as standardggplot. The Google API has got a bad rep recently, as it has introduced mandatory API registration and a set of rather strict Terms & Conditions.leafletis the odd one out. It interfaces to the leaflet.js library and has, by necessity, somewhat unfamiliar syntax. But it allows for interactive vizualizations that users just love.
To illustrate my point:
library(sf)
library(ggmap)
library(leaflet)
library(tidyverse)

# NC counties - a shapefile shipped with the sf package
shape <- sf::st_read(system.file("shape/nc.shp",
                                 package ="sf"))

# three cities - note the x and y coordinates
points <- data.frame(name = c("Raleigh", "Greensboro", "Wilmington"),
                     x = c(-78.633333, -79.819444, -77.912222),
                     y = c(35.766667, 36.08, 34.223333))

# a plot - no more, no less...
ggplot(data = points) +
  geom_point(aes(x = x, y = y), col = "red") + # the points
  geom_sf(data = shape, col = "grey45", fill = NA) # the counties
You should find this ggplot syntax familiar...

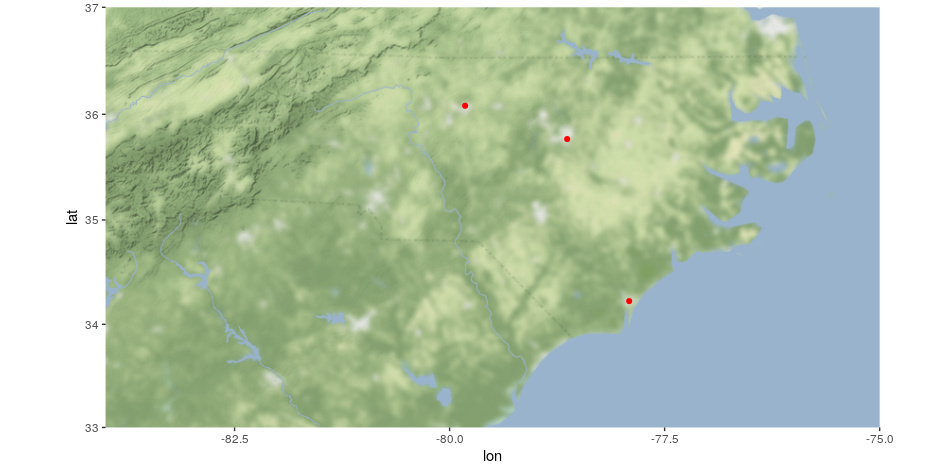
If you desire a basemap underlying your points you should consider ggmap package.
# ggmap - first download stamen background
go_tar_heels <- ggmap::get_stamenmap(bbox = c(left = -84,
                                              bottom = 33,
                                              right = -75,
                                              top = 37),
                          zoom = 7,
                          maptype = "terrain-background")

# plot on the background, using standard ggplot syntax
ggmap::ggmap(go_tar_heels) +
  geom_point(data = points, aes(x = x, y = y), col = "red")
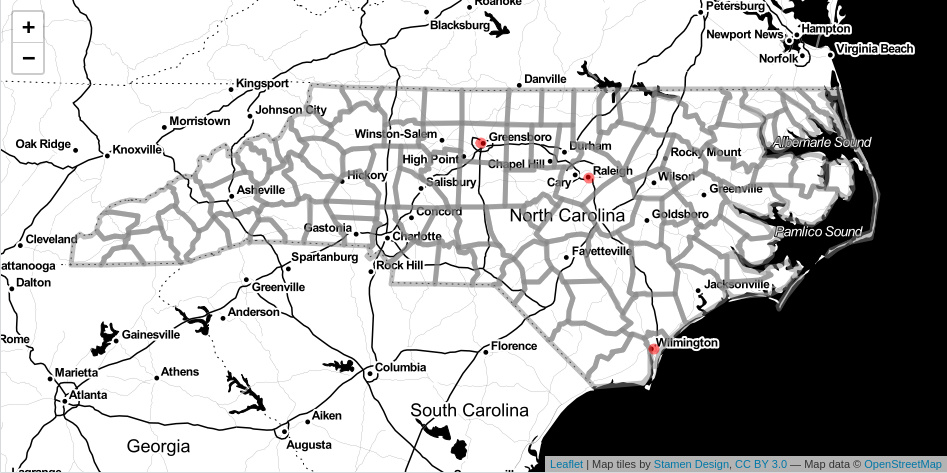
Leaflet will give you interactivity - something not easily reproducible in the confines of this forum (try running the code in your RStudio to get the feel!). It is not easily screenshotted, but users seem to enjoy it...
# first standardize the spatial objects
points <- sf::st_as_sf(points, coords = c("x", "y"), crs = 4326)
shape <- sf::st_transform(shape, crs = 4326)

# and then plot them
leaflet() %>%
  addProviderTiles("Stamen.Toner") %>%
  addPolygons(data = shape, fill = NA, color = "grey") %>%
  addCircleMarkers(data = points, color = "red", radius = 3)
A shameless plug: I have recently written a blog post on tips & tricks for working with leaflet - have a look here: Leaflet in R · Jindra Lacko
If animation is your goal (somewhat out of the scope of this post) I suggest sticking to ggplot, as it has the gganimate extension that works fine with spatial data objects. Leaflet is out of the question.