Best packages for making map? leaflet vs ggmap vs sf vs ...?

Hey all,

I'm just now getting into using R to visualize locations on a map. For example, I have 30 locations all within a city, an I want to plot them on a map, using a color to highlight something about their relative prices. If this wasn't a map, I'd just use

ggplot(data = df, aes(x = long, y = lat, color = price)) +
  geom_point()

or something like that.

I started looking into plotting packages, and I see (at least) 3 - ggmap, leaflet, and sf. Does anyone have opinions on the differences between these? Positives, and negatives, when one is better than the other, etc...

Would it matter if I wanted to make an animation of how the prices change over time?

Thanks!

Hi,

a few comments:

  • your ggplot syntax is in fact perfectly legit (as illustrated below)
  • sf package, like its predecessor sp, is not a package oriented to plotting, but to spatial data manipulation. It introduces a special format - a data.frame extension - that can be used to read and process spatial objects (points, lines, polygons), but drawing of a chart has to be done elsewhere (suppose ggplot::geom_sf if you are already familiar with ggplot)
  • ggmap provides interface to the Google and Open Street Map APIs and is a ggplot extension, meaning it uses the same syntax as standard ggplot. The Google API has got a bad rep recently, as it has introduced mandatory API registration and a set of rather strict Terms & Conditions.
  • leaflet is the odd one out. It interfaces to the leaflet.js library and has, by necessity, somewhat unfamiliar syntax. But it allows for interactive vizualizations that users just love.

To illustrate my point:

library(sf)
library(ggmap)
library(leaflet)
library(tidyverse)

# NC counties - a shapefile shipped with the sf package
shape <- sf::st_read(system.file("shape/nc.shp", 
                                 package ="sf")) 

# three cities - note the x and y coordinates
points <- data.frame(name = c("Raleigh", "Greensboro", "Wilmington"),
                     x = c(-78.633333, -79.819444, -77.912222),
                     y = c(35.766667, 36.08, 34.223333)) 

# a plot - no more, no less...
ggplot(data = points) +
  geom_point(aes(x = x, y = y), col = "red") + # the points
  geom_sf(data = shape, col = "grey45", fill = NA) # the counties

You should find this ggplot syntax familiar...

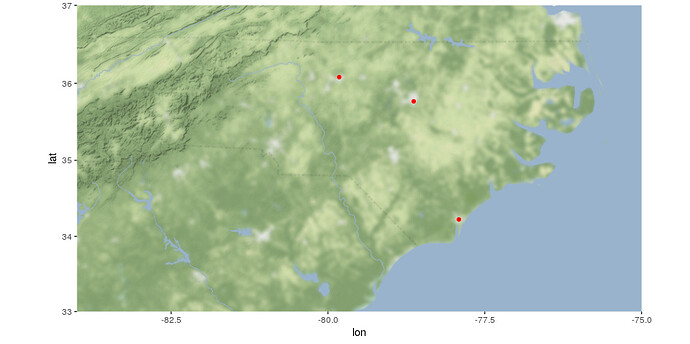
If you desire a basemap underlying your points you should consider ggmap package.

# ggmap - first download stamen background 
go_tar_heels <- ggmap::get_stamenmap(bbox = c(left = -84, 
                                              bottom = 33, 
                                              right = -75, 
                                              top = 37),
                          zoom = 7, 
                          maptype = "terrain-background")

# plot on the background, using standard ggplot syntax
ggmap::ggmap(go_tar_heels) +
  geom_point(data = points, aes(x = x, y = y), col = "red")

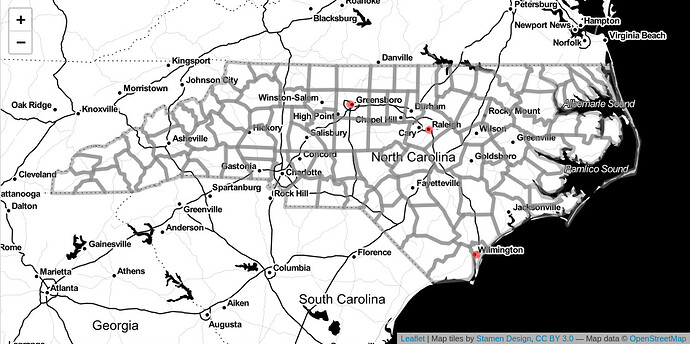
Leaflet will give you interactivity - something not easily reproducible in the confines of this forum (try running the code in your RStudio to get the feel!). It is not easily screenshotted, but users seem to enjoy it...

# first standardize the spatial objects
points <- sf::st_as_sf(points, coords = c("x", "y"), crs = 4326)
shape <- sf::st_transform(shape, crs = 4326)

# and then plot them
leaflet() %>% 
  addProviderTiles("Stamen.Toner") %>% 
  addPolygons(data = shape, fill = NA, color = "grey") %>% 
  addCircleMarkers(data = points, color = "red", radius = 3)

A shameless plug: I have recently written a blog post on tips & tricks for working with leaflet - have a look here: Leaflet in R · Jindra Lacko

If animation is your goal (somewhat out of the scope of this post) I suggest sticking to ggplot, as it has the gganimate extension that works fine with spatial data objects. Leaflet is out of the question.

9 Likes

Thank you - very complete!

I will try leaflet -- its interactivity could substitute for animation. I will also check out your blogpost.

Have you seen any other packages/methods in R I should know about?

I think that ggplot and leaflet will handle most of your needs.

A honorable mention goes to tmap package - GitHub - mtennekes/tmap: R package for thematic maps. It introduces yet another map making syntax, and produces decent maps with very little tweaking. It supports both static and dynamic output. But competing against ggplot in static maps is hard, and in dynamic mapping using leaflet directly gives you more control. If you are familiar with ggplot syntax I would leave it out.

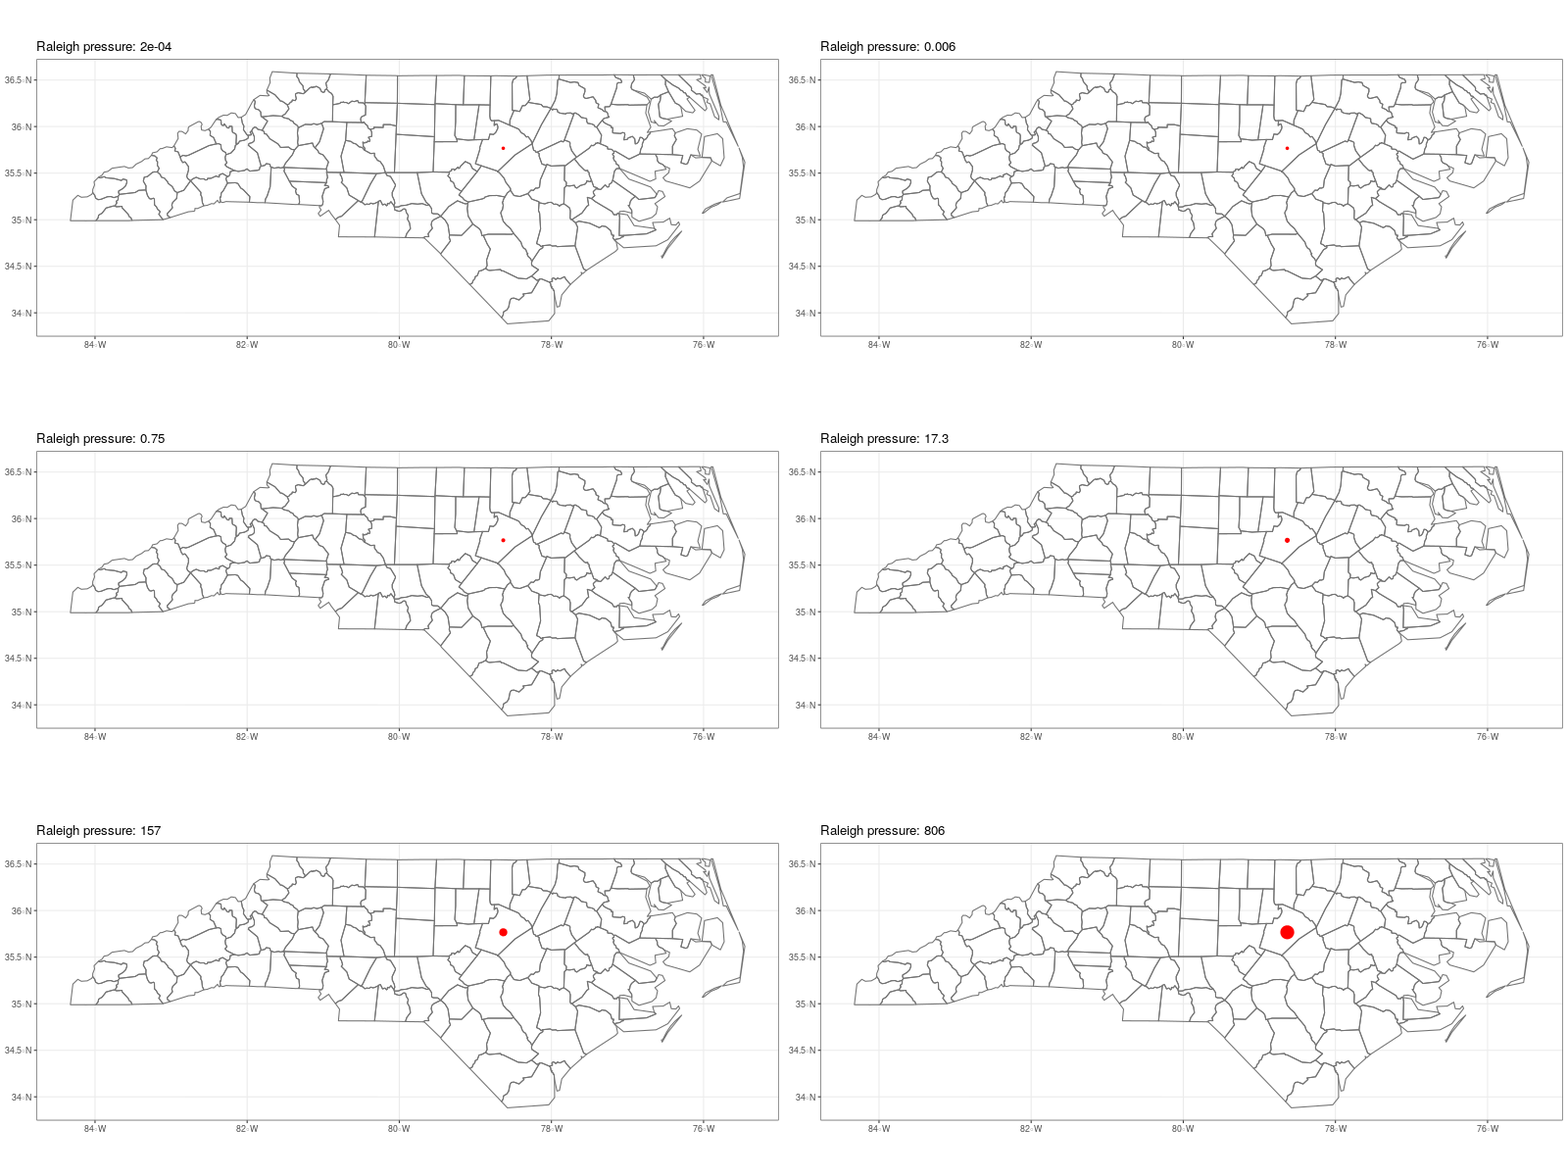
And as my curiosity got the better of me I propose a workflow for animated maps, built on ggplot and gganimate. The hardest part was faking the data to be animated; at the end I ended up recycling the well known & loved pressure dataset.

library(sf)
library(gganimate)
library(tidyverse)

# NC counties - a shapefile shipped with the sf package
shape <- sf::st_read(system.file("shape/nc.shp", 
                                 package ="sf")) 

# one city - let recycling multiply the name & coordinates
points <- data.frame(name = c("Raleigh"),
                     x = c(-78.633333),
                     y = c(35.766667),
                     value = pressure$pressure) 

# a plot - with a few extras :)
obrazek <- ggplot(data = points) +
  geom_point(aes(x = x, y = y, size = value), col = "red") + # the points
  geom_sf(data = shape, col = "grey45", fill = NA) + # the counties
  theme_bw() +
  theme(axis.title = element_blank()) +
  guides(size = F) +
  labs(title = 'Raleigh pressure: {closest_state}') +
  gganimate::transition_states(value, 
                               transition_length = 1,
                               state_length = 2) +
  gganimate::ease_aes('sine-in-out')

# create animation
gganimate::animate(obrazek, nframes = 2*(nrow(points)+1), 
                   height = 400, width = 800, fps = 10, 
                   renderer = gifski_renderer(loop = T))

# save animation  
gganimate::anim_save('animated_map.gif')

animated_map

1 Like

This topic was automatically closed 7 days after the last reply. New replies are no longer allowed.