Hi all
I have a data set, which I use to visualize the amount of samples based on a filter that I apply with checkboxes in the UI. As I click one, it seems to work, but when I click a second (,third...), I want to have the cumulative count of that selection. Now I seems like it takes the mean value?
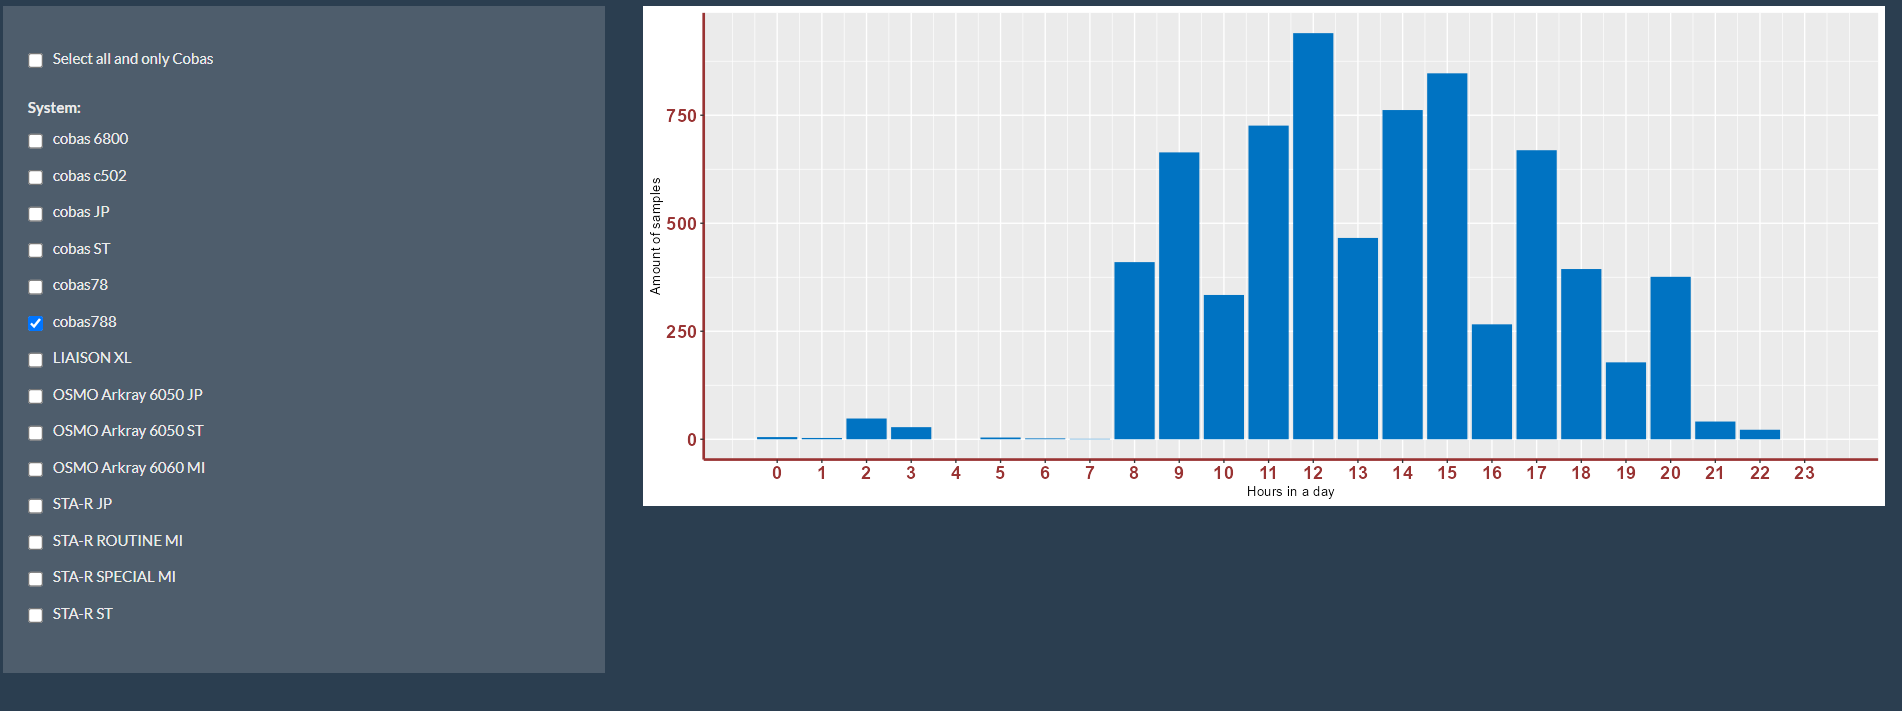
First image is one selection (is good):
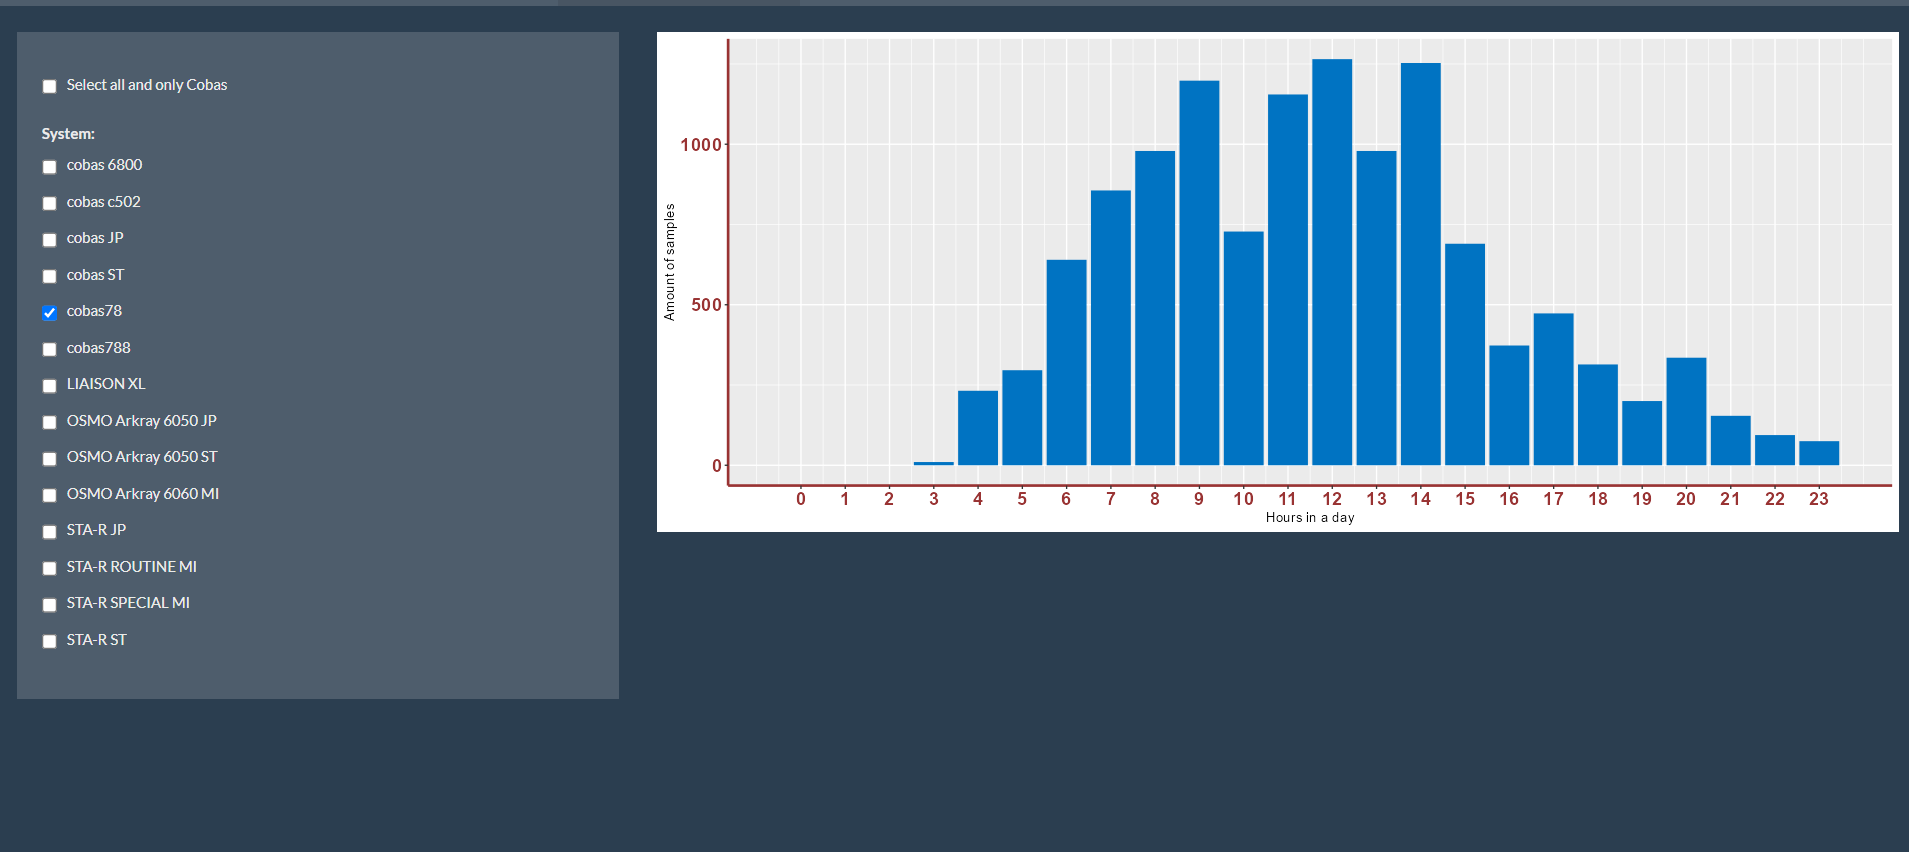
Second image is second, separate selection (is good):
Third image is both selections combined (I expect the sum of the amount of samples form both machines, but it goes wrong somewhere.):
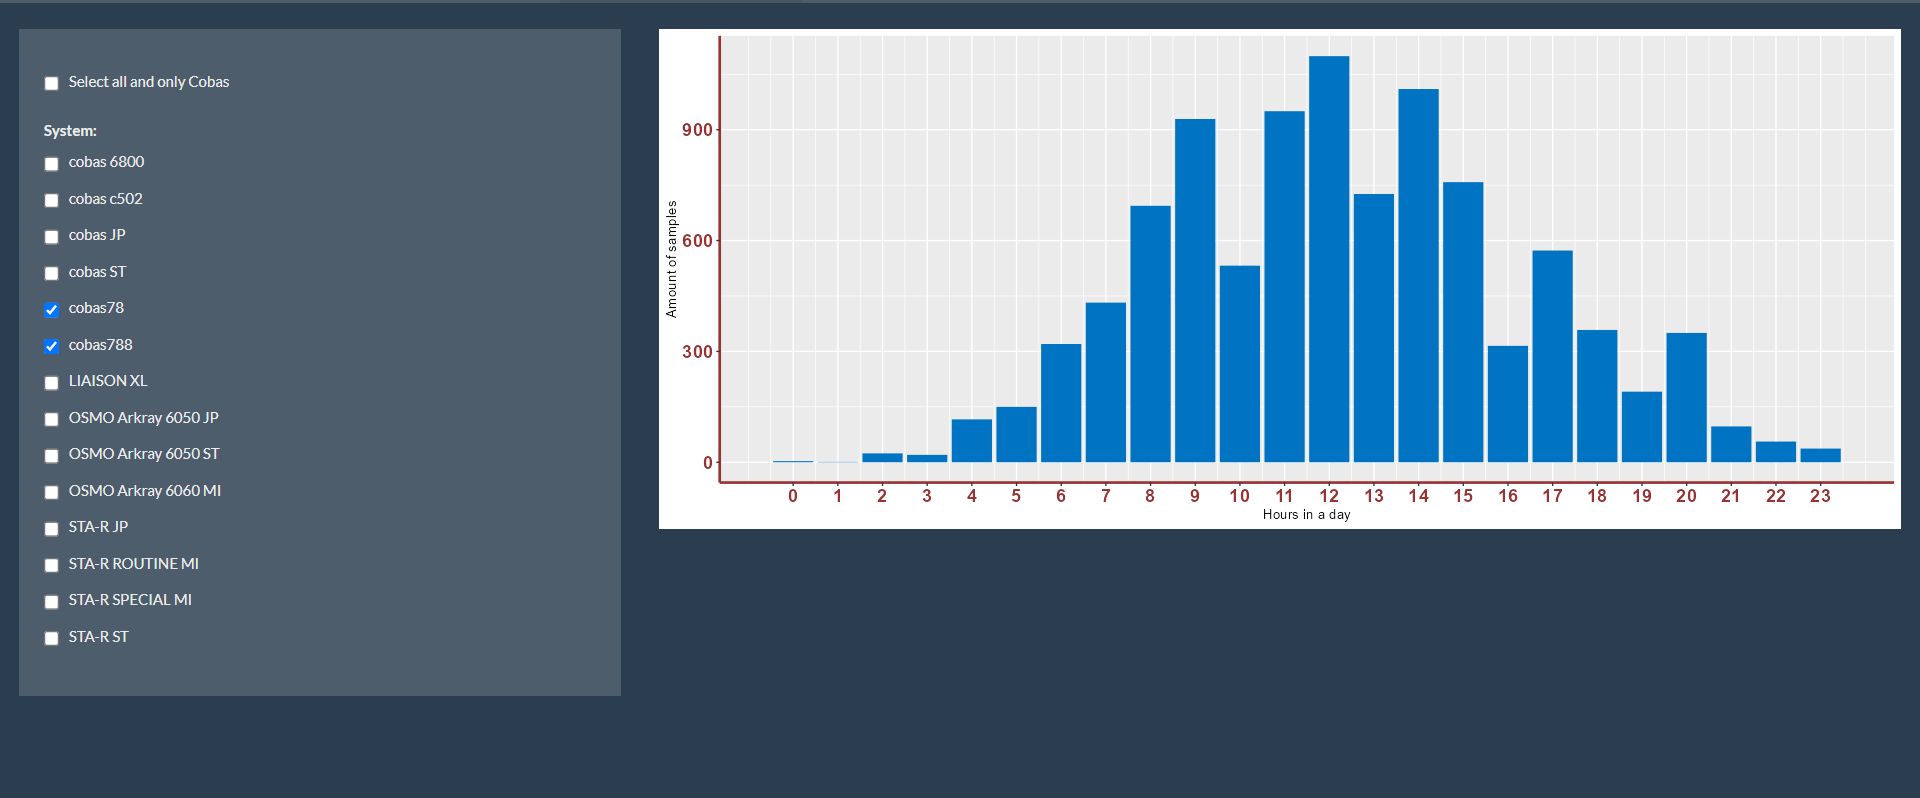
Like I would expect that the amount of samples of both is around (900 + 1250=) +/- 2150 samples on 12h, but seems like it is just +/- 1100 samples.
This is the UI code chunk about the checkbox:
  tabPanel("Distribution based on SYSTEM", icon = icon("fa-duotone fa-microscope", verify_fa = FALSE),
                                    sidebarLayout(
                                      sidebarPanel(
                                        checkboxInput("all_cobas", label = "Select all and only Cobas", value = FALSE),
                                        checkboxGroupInput("system", "System:", choices = NULL, selected = NULL)),
                                      mainPanel(
                                        plotOutput("barplot3"))))
This is the server code chunk:
updateCheckboxGroupInput(session, 'system', label = NULL, choices = sort(unique(df1$InstrumentName)),
                                                 selected = NULL, inline = FALSE)

    output$barplot3 <- renderPlot({

        if(input$all_cobas == TRUE) {
          df1_filtered <- df1[grep("cobas", df1$InstrumentName), ]
        }
        else {
          df1_filtered <- df1[df1$InstrumentName == input$system,]
        }

        #Calculate the amount of Result-samples each hour:
        hours_set <- hms(df1_filtered$ResultTime)
        df2 <- as.data.frame(hours_set$hour)
        df_aggr_Result <- aggregate(df2, by=list(df2$`hours_set$hour`), FUN = length)
        #Renaming
        names(df_aggr_Result)[names(df_aggr_Result) == "Group.1"] <- "hour"
        names(df_aggr_Result)[names(df_aggr_Result) == "hours_set$hour"] <- "amount of samples"

        all_h <- tibble(hour = 0:23)

        df_plot = merge(x=all_h,y=df_aggr_Result,by="hour",all=TRUE)
        df_plot[is.na(df_plot)] <- 0

        ggplot(df_plot, aes(x = df_plot$hour, y = df_plot$`amount of samples`)) +
          geom_bar(fill = "#0073C2FF", stat = "identity") +
          theme(axis.text.x = element_text(face = "bold", color = "#993333", size = 15),
                axis.text.y = element_text(face = "bold", color = "#993333", size = 15),
                axis.line = element_line(color = "#993333", size = 1)) +
          scale_x_continuous(breaks=seq(0,23,1)) +
          xlab("Hours in a day") + ylab("Amount of samples")
    })
I have the feeling that it is something very small to adapt.
Thanks in advance!