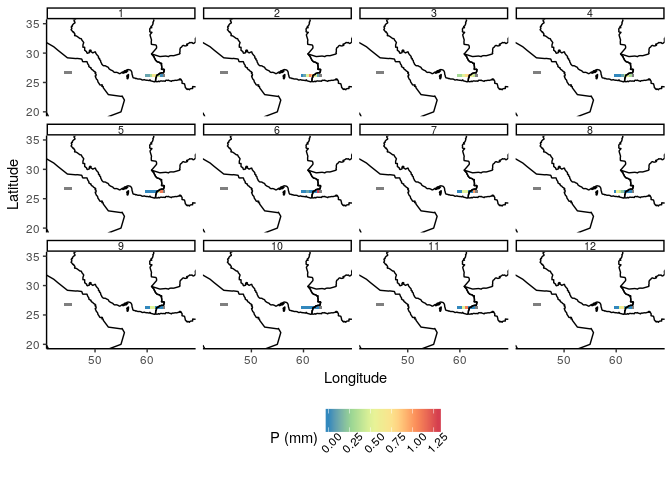
You could manually define (fine tune) more suitable limits for the plot e.g.
coord_quickmap(xlim=c(42, 68), ylim = c(20, 35)) +

You could manually define (fine tune) more suitable limits for the plot e.g.
coord_quickmap(xlim=c(42, 68), ylim = c(20, 35)) +
