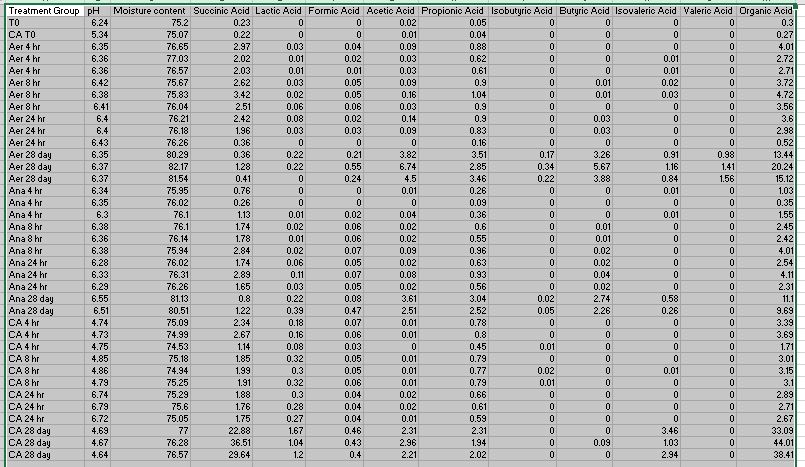
So I've attached a picture of my csv, hopefully it shows here. Basically, what I want to do is create a column for the average of each respective column amongst each treatment group. Then I want to have a graph that has the treatment groups as the x-axis, and then the average for each of the acids as a different column. So within the Aer 4 hr group there will be a bar for the average of Succinic Acid, the average of Lactic Acid, etc. Then Aer 8 hr will have the same columns. Does this make sense? I'm not sure how to format the plotting information to use all of the average columns as they are all different variables. Or how to format the data.frame so that I can make all of these into an extra variable.
the code I'm using:
# RSTUDIO PACKAGE INSTALLATION ################################################

library(janitor)
library(tidyverse)
library(ggplot2)
library(readr)
library(dplyr)

# IMPORT THE DATA #############################################################
organic_acids<-read.csv(file='OCT19_Queue_organic acid summary8.csv')


organic_acids
summary(organic_acids)

# FORMATTING SPREADSHEET COLUMN NAMES AND TYPES ###############################

colnames(organic_acids)<-gsub("X..","",colnames(organic_acids))

colnames(organic_acids)<-gsub("..db.","",colnames(organic_acids))

colnames(organic_acids)<-gsub(".Acid","_Acid",colnames(organic_acids))

colnames(organic_acids)<-gsub("ï..","",colnames(organic_acids))

organic_acids<-organic_acids %>%
  rename("experiment_id"='Experiment.ID',
           'sample_name'='OA.sample.name',
         'treatment_group'='Sample_overview',
         'wet_biomass_extracted_g'='Wet.Biomass.extracted',
         'mc_content'='Moisture.content',
         'dry_biomass_g'='Dry.Biomass.extracted')

organic_acids<-organic_acids %>%
  mutate(across(contains(c("mc_content","MC_avg","_Acid","A_avg","total_avg","A_stdev","total_stdev")),parse_number))

organic_acids

# summary(organic_acids)
# view(organic_acids)
# sapply(organic_acids,class)

# CREATING DATA PLOTS #########################################################

plotting_variables<-organic_acids %>%
  select(treatment_group,SA_avg,LA_avg,FA_avg,AA_avg,PA_avg,IBA_avg,BA_avg,IVA_avg,VA_avg,
         OA_total_avg)

plotting_variables_remove_na<-na.omit(plotting_variables)

plotting_variables_remove_na


numeric_variables<-plotting_variables_remove_na %>%
  select(SA_avg,LA_avg,FA_avg,AA_avg,PA_avg,IBA_avg,BA_avg,IVA_avg,VA_avg,
           OA_total_avg)

numeric_variables<-data.frame(x=unlist(numeric_variables))

numeric_variables

################################
plotting_variables_remove_na %>%
  ggplot()+
  geom_col(aes(x=treatment_group,y=numeric_variables))
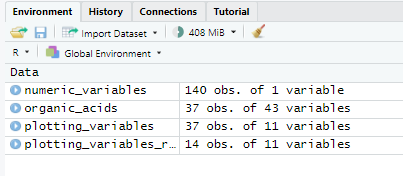
This is what my environment looks like for number of variables
And this is the error I'm getting:
> plotting_variables_remove_na %>%
+   ggplot()+
+   geom_col(aes(x=treatment_group,y=numeric_variables))
Don't know how to automatically pick scale for object of type data.frame. Defaulting to continuous.
Error in is.finite(x) : default method not implemented for type 'list'
I know this a very roundabout way of getting this plot, but I've tried a lot of different things and can't get it to work. I'm very new to coding in general, especially R and I can't seem to figure it out. I tried unlisting the information in the numeric_variables to try to get it to just one variable to use the aes(). When I tried without the listing it was having problems as the y was then more than one variable. I'm just very confused. I don't know if I need to make a new data frame and merge something? Any help at all would be very helpful.