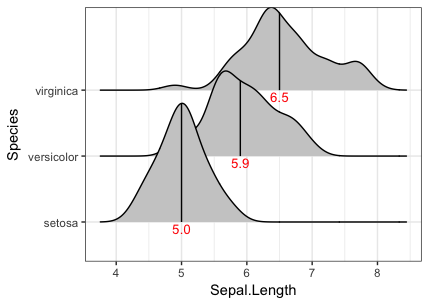
You can use geom_text to add the labels if you presummarize the quantile values. For example:
library(tidyverse)
theme_set(theme_bw())
library(ggridges)

ggplot(iris, aes(x=Sepal.Length, y=Species)) +
  stat_density_ridges(quantile_lines = TRUE, quantiles = 2, fill="grey80") +
  geom_text(data=iris %>% group_by(Species) %>%
              summarise(Sepal.Length=median(Sepal.Length)),
            aes(label=sprintf("%1.1f", Sepal.Length)),
            position=position_nudge(y=-0.1), colour="red", size=3.5)
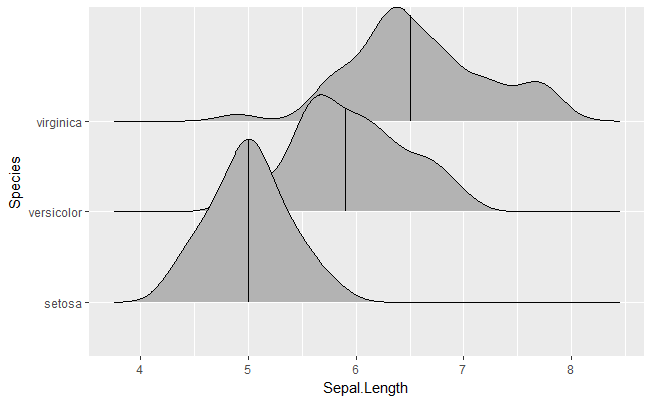
You can also do it with stat_summaryh from the ggstance package to avoid having to explicitly summarise the data:
library(ggstance)

ggplot(iris, aes(x=Sepal.Length, y=Species)) +
  stat_density_ridges(quantile_lines = TRUE, quantiles = 2, fill="grey80") +
  stat_summaryh(fun.x=median, geom="text", aes(label=sprintf("%1.1f", ..x..)),
                position=position_nudge(y=-0.1), colour="red", size=3.5)
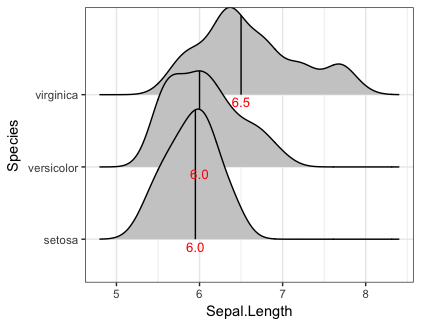
Note that this approach can run into trouble if the density distributions overlap at the label values, as in the example below. You can shift the label location around with position_nudge, but I'm not sure how to get full control over the label positions within the ggridges framework. (I'll try to take a look at the package code and see if any ideas come to me.)
ggplot(iris %>%
         mutate(Sepal.Length=ifelse(Sepal.Length<5.5,Sepal.Length+1,Sepal.Length)),
       aes(x=Sepal.Length, y=Species)) +
  stat_density_ridges(quantile_lines = TRUE, quantiles = 2, fill="grey80") +
  stat_summaryh(fun.x=median, geom="text", aes(label=sprintf("%1.1f", ..x..)),
                position=position_nudge(y=-0.1), colour="red", size=3.5)