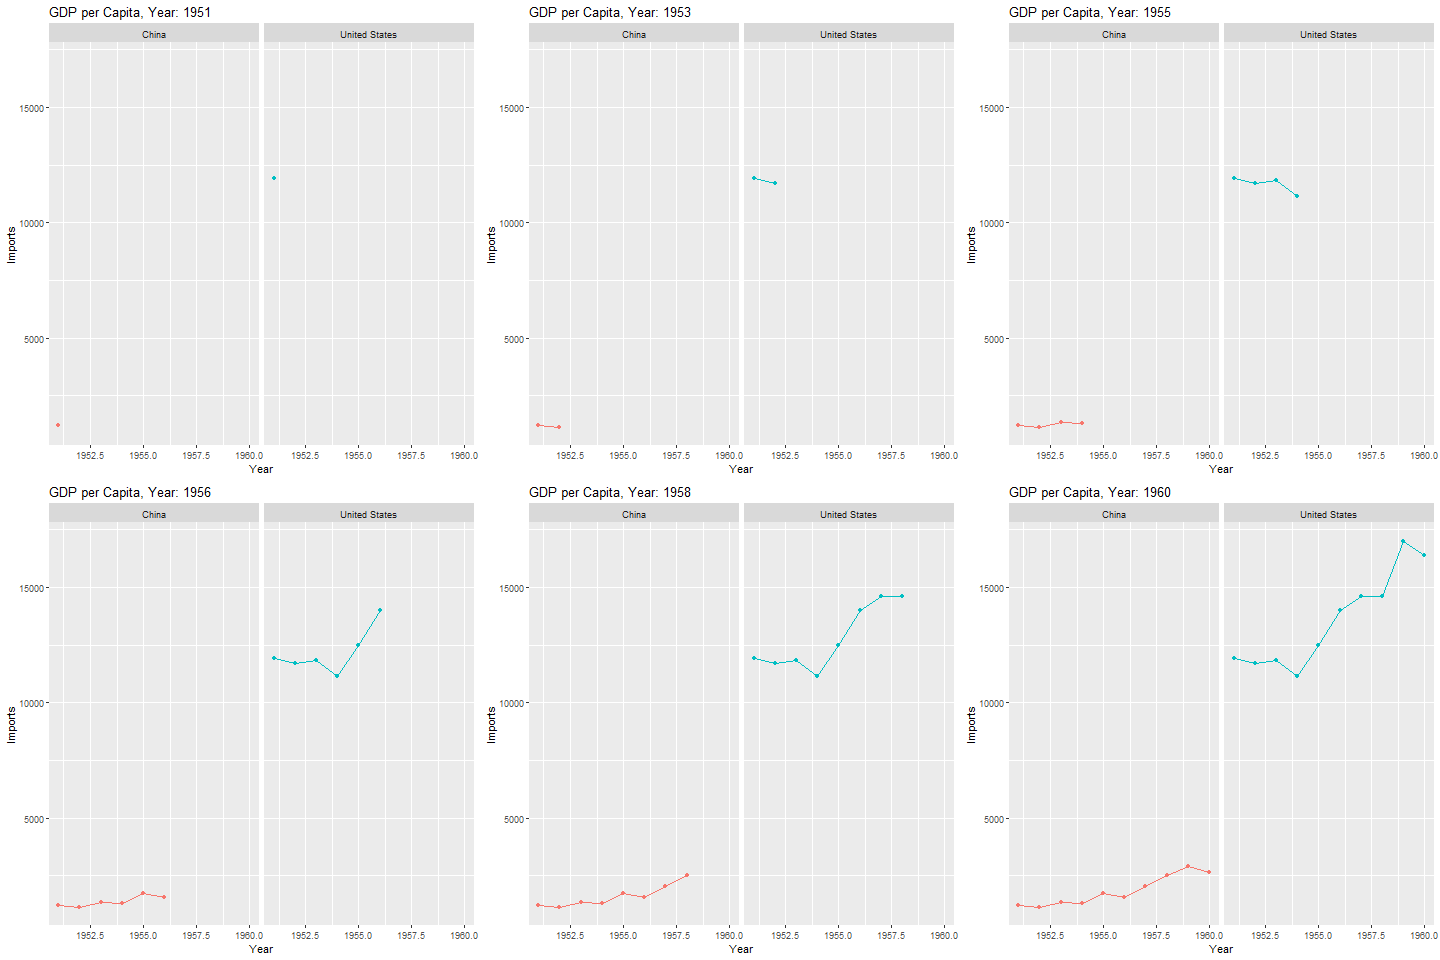
gganimate with lines.

I am trying to produce line animation with a leading dot. My code is as follows.

p <- ggplot(exim1, aes(x = Year, y = value, color = Country)) +
  geom_path() +
  geom_point() +
  facet_grid(Flow ~ Country) +
  theme(legend.position = 'none') +
  labs(title = 'GDP per Capita, Year: {frame_time}') +
  transition_time(Year) +
  ease_aes('linear')

animate(p, 100, 10)

It does not do any good except dots moving, no path. It also gives this error. geom_path: Each group consists of only one observation. Do you need to adjust the group aesthetic?exim1

I can't be sure this will work for you with a reprex, but I think you need to use transition_reveal instead of transition_time for geom_path/geom_line.

So you would do:

p <- ggplot(exim1, aes(x = Year, y = value, color = Country)) +
  geom_path() +
  geom_point() +
  facet_grid(Flow ~ Country) +
  theme(legend.position = 'none') +
  labs(title = 'GDP per Capita, Year: {frame_time}') +
  transition_reveal(id = Year, along = Year) +
  ease_aes('linear')

animate(p, 100, 10)

You have to pass the Year column name to both the id and along arguments of the function.

I need to send the data, but don't know if something like dput is available here.

You can use dput(), we just ask that you use a minimal sample of your data rather than the whole thing if it's large. You might also check out datapasta, I wrote up a little how to for datapasta with reprex here:
https://reprex.tidyverse.org/articles/articles/datapasta-reprex.html

1 Like

Here is an example reprex using transition_time and also datapasta to show you how you can share the data. In your reprex I would recommend not putting the actual datapasta::dpasta call into the reprex, but just do something like what is shown below where you assign the output to a variable.

library(tidyverse)
library(gganimate)
library(datapasta)
library(gapminder)

gapminder::gapminder %>% 
  filter(country %in% c("United States", "Canada")) %>% 
  datapasta::dpasta()
#> Warning in tribble_construct(input_table, oc = output_context): Column(s)
#> 1,2 have been converted from factor to character in tribble output.
#> tibble::tribble(
#>          ~country, ~continent, ~year, ~lifeExp,       ~pop,  ~gdpPercap,
#>          "Canada", "Americas", 1952L,    68.75,  14785584L, 11367.16112,
#>          "Canada", "Americas", 1957L,    69.96,  17010154L, 12489.95006,
#>          "Canada", "Americas", 1962L,     71.3,  18985849L, 13462.48555,
#>          "Canada", "Americas", 1967L,    72.13,  20819767L, 16076.58803,
#>          "Canada", "Americas", 1972L,    72.88,  22284500L, 18970.57086,
#>          "Canada", "Americas", 1977L,    74.21,  23796400L, 22090.88306,
#>          "Canada", "Americas", 1982L,    75.76,  25201900L, 22898.79214,
#>          "Canada", "Americas", 1987L,    76.86,  26549700L, 26626.51503,
#>          "Canada", "Americas", 1992L,    77.95,  28523502L, 26342.88426,
#>          "Canada", "Americas", 1997L,    78.61,  30305843L, 28954.92589,
#>          "Canada", "Americas", 2002L,    79.77,  31902268L, 33328.96507,
#>          "Canada", "Americas", 2007L,   80.653,  33390141L, 36319.23501,
#>   "United States", "Americas", 1952L,    68.44, 157553000L, 13990.48208,
#>   "United States", "Americas", 1957L,    69.49, 171984000L, 14847.12712,
#>   "United States", "Americas", 1962L,    70.21, 186538000L, 16173.14586,
#>   "United States", "Americas", 1967L,    70.76, 198712000L, 19530.36557,
#>   "United States", "Americas", 1972L,    71.34, 209896000L, 21806.03594,
#>   "United States", "Americas", 1977L,    73.38, 220239000L, 24072.63213,
#>   "United States", "Americas", 1982L,    74.65, 232187835L, 25009.55914,
#>   "United States", "Americas", 1987L,    75.02, 242803533L, 29884.35041,
#>   "United States", "Americas", 1992L,    76.09, 256894189L, 32003.93224,
#>   "United States", "Americas", 1997L,    76.81, 272911760L, 35767.43303,
#>   "United States", "Americas", 2002L,    77.31, 287675526L, 39097.09955,
#>   "United States", "Americas", 2007L,   78.242, 301139947L, 42951.65309
#>   )


df <- tibble::tribble(
                                       ~country, ~continent, ~year, ~lifeExp,       ~pop,  ~gdpPercap,
                                       "Canada", "Americas", 1952L,    68.75,  14785584L, 11367.16112,
                                       "Canada", "Americas", 1957L,    69.96,  17010154L, 12489.95006,
                                       "Canada", "Americas", 1962L,     71.3,  18985849L, 13462.48555,
                                       "Canada", "Americas", 1967L,    72.13,  20819767L, 16076.58803,
                                       "Canada", "Americas", 1972L,    72.88,  22284500L, 18970.57086,
                                       "Canada", "Americas", 1977L,    74.21,  23796400L, 22090.88306,
                                       "Canada", "Americas", 1982L,    75.76,  25201900L, 22898.79214,
                                       "Canada", "Americas", 1987L,    76.86,  26549700L, 26626.51503,
                                       "Canada", "Americas", 1992L,    77.95,  28523502L, 26342.88426,
                                       "Canada", "Americas", 1997L,    78.61,  30305843L, 28954.92589,
                                       "Canada", "Americas", 2002L,    79.77,  31902268L, 33328.96507,
                                       "Canada", "Americas", 2007L,   80.653,  33390141L, 36319.23501,
                                "United States", "Americas", 1952L,    68.44, 157553000L, 13990.48208,
                                "United States", "Americas", 1957L,    69.49, 171984000L, 14847.12712,
                                "United States", "Americas", 1962L,    70.21, 186538000L, 16173.14586,
                                "United States", "Americas", 1967L,    70.76, 198712000L, 19530.36557,
                                "United States", "Americas", 1972L,    71.34, 209896000L, 21806.03594,
                                "United States", "Americas", 1977L,    73.38, 220239000L, 24072.63213,
                                "United States", "Americas", 1982L,    74.65, 232187835L, 25009.55914,
                                "United States", "Americas", 1987L,    75.02, 242803533L, 29884.35041,
                                "United States", "Americas", 1992L,    76.09, 256894189L, 32003.93224,
                                "United States", "Americas", 1997L,    76.81, 272911760L, 35767.43303,
                                "United States", "Americas", 2002L,    77.31, 287675526L, 39097.09955,
                                "United States", "Americas", 2007L,   78.242, 301139947L, 42951.65309
                                )


p <- df %>% 
  ggplot(aes(x = year, y = lifeExp, color = country)) + 
  geom_path() + 
  geom_point() + 
  facet_grid(~country) + 
  transition_reveal(id = year, along = year) + 
  ease_aes("linear")


animate(p, 100, 20)
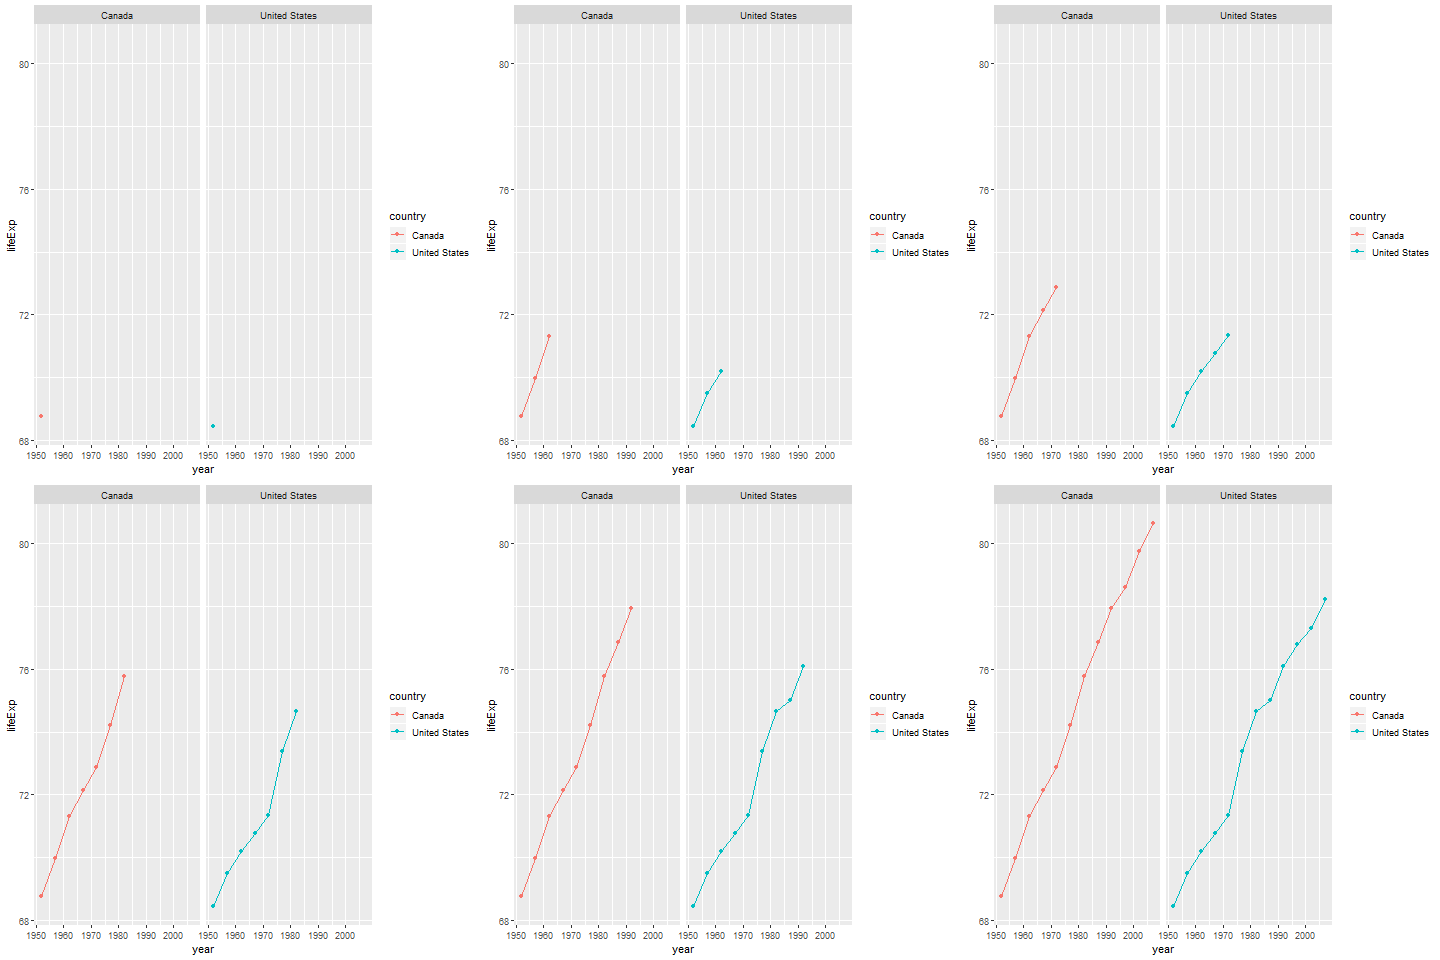
Created on 2018-12-18 by the reprex package (v0.2.0).
2 Likes

Thanks, Mara, That would be great.
best,
Ambrish

I created small data file with dput() but the uploader here refuses to take up the file :frowning:

That's the stuff I am in need of. But, I have already done the data dressing and to keep the thing simple with all the conventional use of libraries (I mean I have no idea of using tibble etc). I want to handle my stuff, which I guess can be done. With current set of code. All I need is to send you some data, but the file generated by dput() is no more than 10 kb however that sort of extensions are blocked here from being uploaded

Did you try just simply changing your gganimate code from transition_time to transition_reveal like I suggested?

If you tried that and it does not work, can you share any error messages you got from that code.

Also, I am not sure what "file" you are generating from dput. dput returns a copy-and-paste ready output that you would just paste into the browser. However, I highly discourage just copy and pasting a dput output on any dataframe that is more than ~20 ish rows. The output will be massive and likely is not needed to answer this problem. If the code already suggested does not work, then you will need to subset your data to make a representative toy dataset that we can use.

Hi, I have used the code as transition_reveal(Year) + ease_aes('linear')
But to no avail. The error I get is this
Error in png::readPNG(frames[1], native = TRUE) : unable to open /tmp/Rtmpwbxjz1/14717359f16/gganim_plot0001.png In addition: There were 50 or more warnings (use warnings() to see the first 50)

As I mentioned in the first post, you need to specify both the id and along arguments of transition_reveal. So you need to add a second Year to transition_reveal. It should look like this

transition_reveal(id = Year, along = Year) + ease_aes("linear")

ok, here is my data, I also learnt how to use dput() properly.

structure(list(Country = c("China", "United States", "China",
"United States", "China", "United States", "China", "United States",
"China", "United States", "China", "United States", "China",
"United States", "China", "United States", "China", "United States",
"China", "United States"), Year = c(1951L, 1951L, 1952L, 1952L,
1953L, 1953L, 1954L, 1954L, 1955L, 1955L, 1956L, 1956L, 1957L,
1957L, 1958L, 1958L, 1959L, 1959L, 1960L, 1960L), Imports = c(1200,
11922, 1120, 11707, 1350, 11846, 1290, 11140, 1730, 12489, 1560,
13987, 2031.03, 14620, 2506.29, 14618, 2892.18, 17008, 2648.46,
16371), Exports = c(760, 13967, 820, 13203, 1020, 12262, 1150,
12854, 1410, 14291, 1650, 17333, 2213.82, 19495, 2725.64, 16367,
3172.46, 16407, 2571.28, 19626)), .Names = c("Country", "Year",
"Imports", "Exports"), row.names = c(NA, 20L), class = "data.frame")

That throws up the same error. no effect!!!

I am not able to reproduce your error with the example data you posted and the code I posted (with a few minor changes given differences in data) in my first post. See the reprex below. Do you have the most recent version of gganimate installed?

library(ggplot2)
library(gganimate)

exim1 <- structure(list(Country = c("China", "United States", "China",
                           "United States", "China", "United States", "China", "United States",
                           "China", "United States", "China", "United States", "China",
                           "United States", "China", "United States", "China", "United States",
                           "China", "United States"), Year = c(1951L, 1951L, 1952L, 1952L,
                                                               1953L, 1953L, 1954L, 1954L, 1955L, 1955L, 1956L, 1956L, 1957L,
                                                               1957L, 1958L, 1958L, 1959L, 1959L, 1960L, 1960L), Imports = c(1200,
                                                                                                                             11922, 1120, 11707, 1350, 11846, 1290, 11140, 1730, 12489, 1560,
                                                                                                                             13987, 2031.03, 14620, 2506.29, 14618, 2892.18, 17008, 2648.46,
                                                                                                                             16371), Exports = c(760, 13967, 820, 13203, 1020, 12262, 1150,
                                                                                                                                                 12854, 1410, 14291, 1650, 17333, 2213.82, 19495, 2725.64, 16367,
                                                                                                                                                 3172.46, 16407, 2571.28, 19626)), .Names = c("Country", "Year",
                                                                                                                                                                                              "Imports", "Exports"), row.names = c(NA, 20L), class = "data.frame")


p <- ggplot(exim1, aes(x = Year, y = Imports, color = Country)) +
  geom_path() +
  geom_point() +
  facet_grid(~ Country) +
  theme(legend.position = 'none') +
  labs(title = 'GDP per Capita, Year: {frame_time}') +
  transition_reveal(id = Year, along = Year) +
  ease_aes('linear')

animate(p, 100, 10)

Created on 2018-12-19 by the reprex package (v0.2.0).

1 Like

why you have L after year. That does not show in my data.

Your years are being interpreted as integers (which are represented with a capital L after them). It does not affect your output, it is just allowing my system to see that they are meant to be integers and not doubles.

Even if I copy paste your script , I get these two errors

Warning message:
The  `id`  argument has been deprecated. Set  `id`  in each layer with the `group` aesthetic 

and

Error in png::readPNG(frames[1], native = TRUE) :                             
  unable to open /tmp/Rtmpwbxjz1/14713fce1079/gganim_plot0001.png
In addition: There were 50 or more warnings (use warnings() to see the first 50)

Caught this second error, it has something to do with this line of code labs(title = 'Year: {frame_time}', y = "Bln Dlrs")

My OS is Linux Mint 19, I guess that should not be the issue.

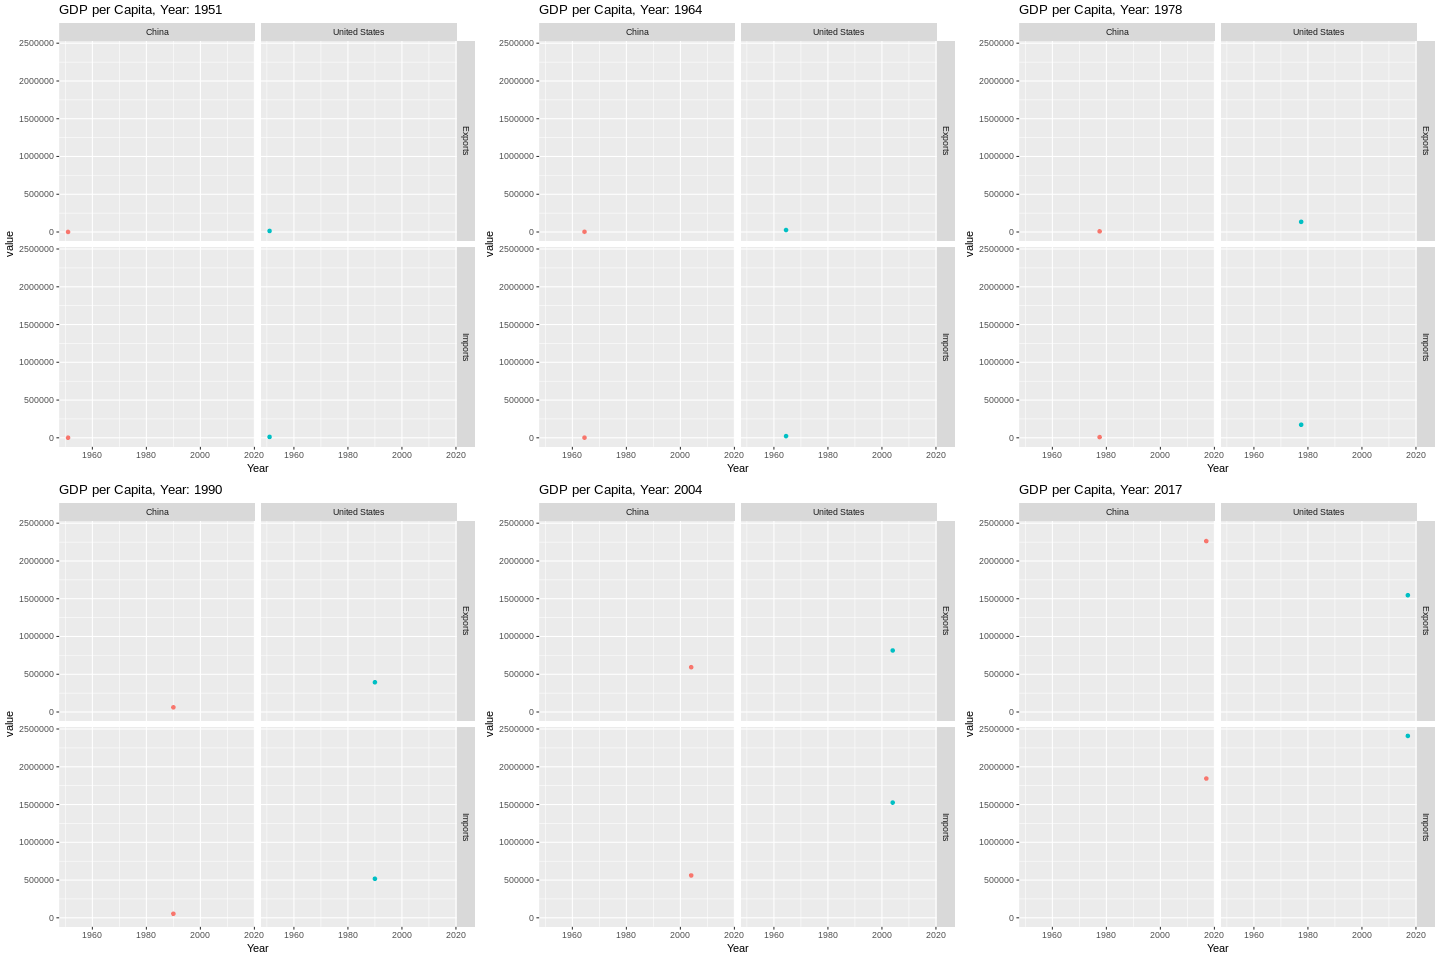
One last thing, I have tried to modify data so that exports and imports are under single column FLOW and now the issue I see is this geom_path: Each group consists of only one observation. Do you need to adjust the group aesthetic?
Can you please tell me how to deal with this

New version of gganimate deprecated the use of id in transition_reveal(), instead uses the group aesthetic.

Just to be sure, I'm going to ask... do you have any renderer installed on your system? i. e. magick, gifsky or ffmpeg