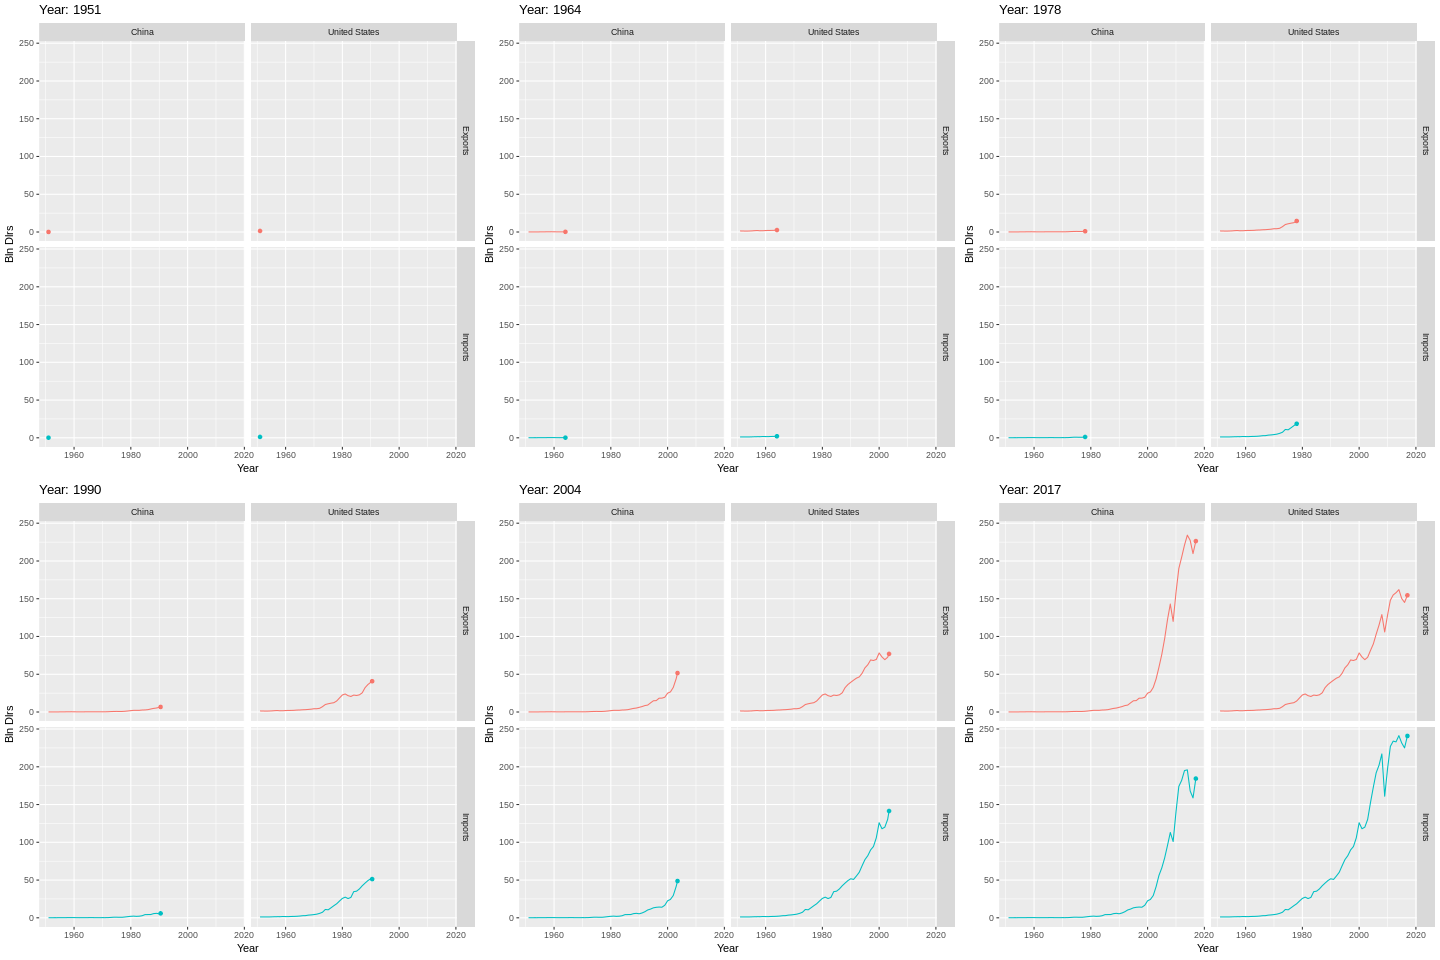
gifsky = yes, magick = yes, ffmpeg = no
Now my first small success is when I filter data as follows
exim2 <- exim %>%
filter(Country %in% c("United States")) %>%
select(Year, Exports)
select(Country)ggplot(exim2, aes(Year, Exports)) +
geom_line() +
geom_point() +
transition_reveal(Year) +
ease_aes('cubic-in-out')
This gives me a good animated line for US exports. But, my issue remains with earlier data.
Try this
library(ggplot2)
library(gganimate)

data <- structure(list(Country = c("China", "United States", "China",
                                   "United States", "China", "United States", "China", "United States",
                                   "China", "United States", "China", "United States", "China",
                                   "United States", "China", "United States", "China", "United States",
                                   "China", "United States"), Year = c(1951L, 1951L, 1952L, 1952L,
                                                                       1953L, 1953L, 1954L, 1954L, 1955L, 1955L, 1956L, 1956L, 1957L,
                                                                       1957L, 1958L, 1958L, 1959L, 1959L, 1960L, 1960L), Imports = c(1200,
                                                                                                                                     11922, 1120, 11707, 1350, 11846, 1290, 11140, 1730, 12489, 1560,
                                                                                                                                     13987, 2031.03, 14620, 2506.29, 14618, 2892.18, 17008, 2648.46,
                                                                                                                                     16371), Exports = c(760, 13967, 820, 13203, 1020, 12262, 1150,
                                                                                                                                                         12854, 1410, 14291, 1650, 17333, 2213.82, 19495, 2725.64, 16367,
                                                                                                                                                         3172.46, 16407, 2571.28, 19626)), .Names = c("Country", "Year",
                                                                                                                                                                                                      "Imports", "Exports"), row.names = c(NA, 20L), class = "data.frame")

p <- ggplot(data, aes(x = Year, y = Imports, color = Country, group = Country)) +
    geom_path() +
    geom_point() +
    facet_grid(~ Country) +
    theme(legend.position = 'none') +
    labs(title = 'GDP per Capita, Year: {frame_along}') +
    transition_reveal(along = Year) +
    ease_aes('linear')

animate(p, 100, 10)
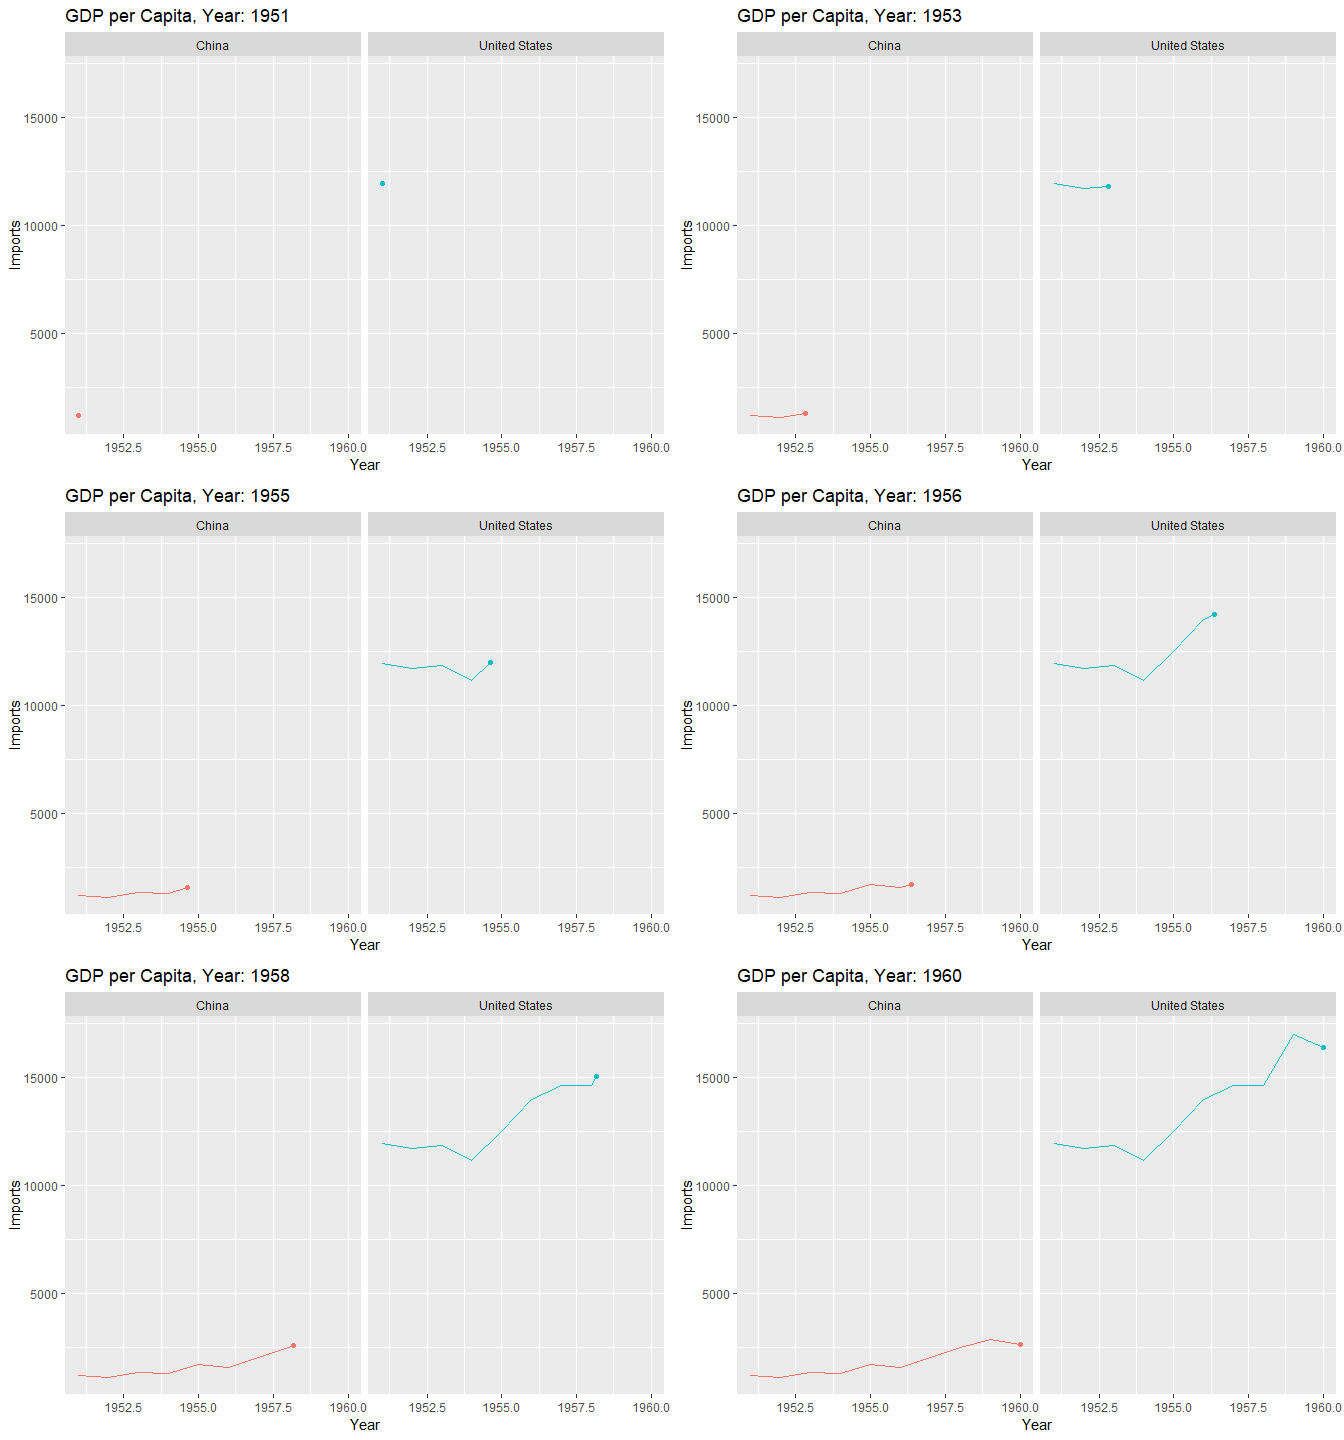
Created on 2018-12-19 by the reprex package (v0.2.1)
Many thanks, finally got the desired thing with this code.
q <- ggplot(exim1, aes(Year, value, color = Flow)) +
geom_line() +
geom_point() +
transition_reveal(Year) +
ease_aes('cubic-in-out') +
theme(legend.position = 'none') +
facet_grid(Country ~ Flow)animate(q, 100, 10)
anim_save("gdep3.gif")
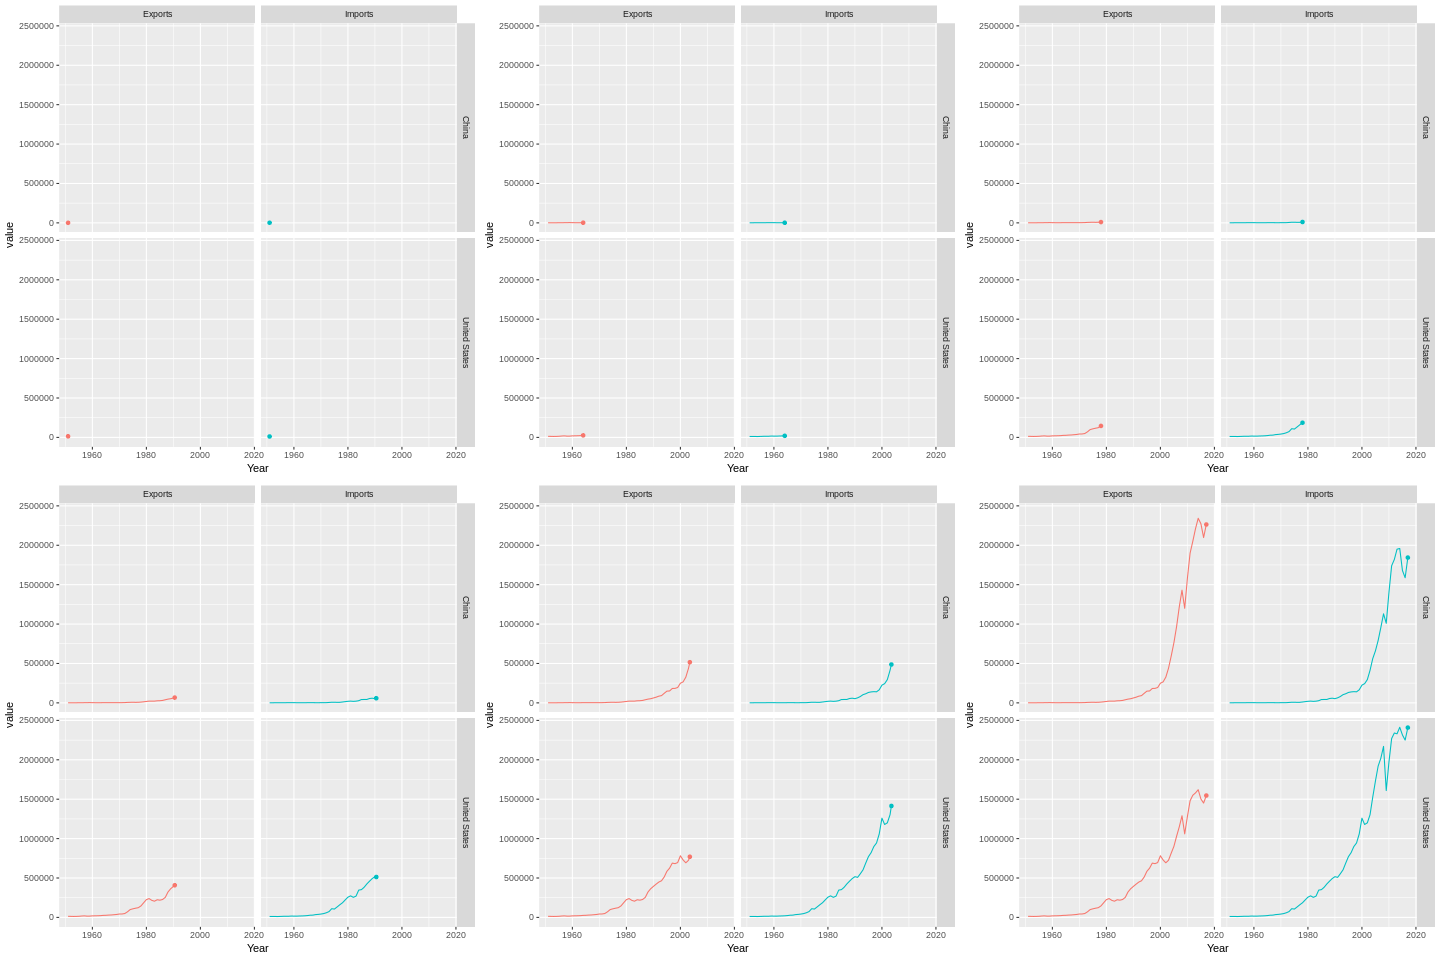
Thanks the last thing that need to be corrected is labs(title = 'Year: {frame_along}')
This completes my quest for current problem. The final image output is this.