Hi,
I would like to obtain all possible combinations for 2x2 table with fixed values of the marginal totals as well as on the overall total.
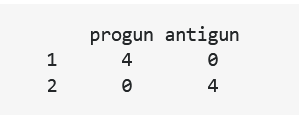
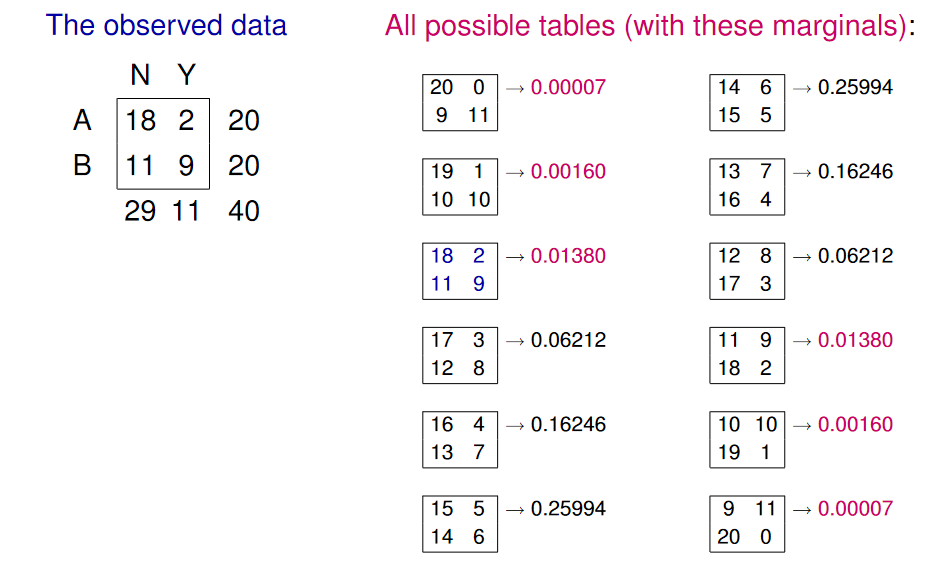
Something like here:
https://stats.stackexchange.com/questions/316195/fishers-exact-test-meaning-of-greater-and-less/316207#316207?newreg=f1c0205e62944a3d9c6f6bdf56f58d77
Specifically this part:
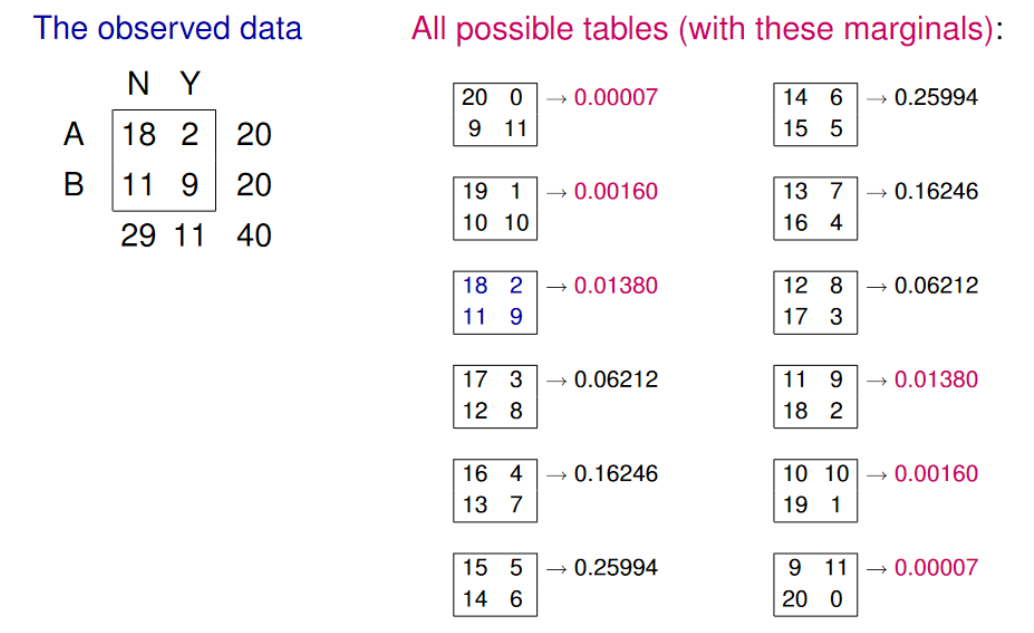
and here for Fisher exact test (fisher.test):
How those tables could be created in R ?
thank you.
There is surely a more elegant way to do this, but a brute-force approach would be to generate all possible 2x2 tables with the given row and column marginals and then filter the ones that satisfy the joint marginal conditions.
library(tidyverse)

## Constraints
r1_marg <- 20
r2_marg <- 20
c1_marg <- 29
c2_marg <- 11

## Range of values
r1c1 <- c(0:max(c(r1_marg, c1_marg)))
r1c2 <- c(0:max(c(r1_marg, c2_marg)))
r2c1 <- c(0:max(c(c1_marg, r2_marg)))
r2c2 <- c(0:max(c(c2_marg, r2_marg)))

## This is super-inefficient and I am
## sure there is a clever way to do
## this directly.
marg_combos <- expand_grid(r1c1, r1c2,
                      r2c1, r2c2) %>%
  filter(r1c1 + r1c2 == r1_marg &
         r2c1 + r2c2 == r2_marg &
         r1c1 + r2c1 == c1_marg &
         r1c2 + r2c2 == c2_marg) %>%
  tibble::rowid_to_column(var = "tab_id") %>%
  pivot_longer(r1c1:r2c2, names_to = "pos") %>%
  group_by(tab_id) %>%
  summarize(mat = list(matrix(value,
                      nrow = 2, ncol = 2, byrow = TRUE))) %>%
  group_by(tab_id) %>%
  mutate(fisher = map(mat, fisher.test)) # probably want to read the fisher docs

marg_combos
#> # A tibble: 12 x 3
#> # Groups:   tab_id [12]
#>    tab_id mat               fisher
#>     <int> <list>            <list>
#>  1      1 <int[,2] [2 × 2]> <htest>
#>  2      2 <int[,2] [2 × 2]> <htest>
#>  3      3 <int[,2] [2 × 2]> <htest>
#>  4      4 <int[,2] [2 × 2]> <htest>
#>  5      5 <int[,2] [2 × 2]> <htest>
#>  6      6 <int[,2] [2 × 2]> <htest>
#>  7      7 <int[,2] [2 × 2]> <htest>
#>  8      8 <int[,2] [2 × 2]> <htest>
#>  9      9 <int[,2] [2 × 2]> <htest>
#> 10     10 <int[,2] [2 × 2]> <htest>
#> 11     11 <int[,2] [2 × 2]> <htest>
#> 12     12 <int[,2] [2 × 2]> <htest>

## E.g.

marg_combos$mat[[1]]
#>      [,1] [,2]
#> [1,]    9   11
#> [2,]   20    0

marg_combos$fisher[[1]]
#>
#>  Fisher's Exact Test for Count Data
#>
#> data:  .x[[i]]
#> p-value = 0.0001453
#> alternative hypothesis: true odds ratio is not equal to 1
#> 95 percent confidence interval:
#>  0.0000000 0.2397675
#> sample estimates:
#> odds ratio
#>          0

marg_combos$mat[[7]]
#>      [,1] [,2]
#> [1,]   15    5
#> [2,]   14    6
Thank you very much indeed Sir, for taking your time to solve this.
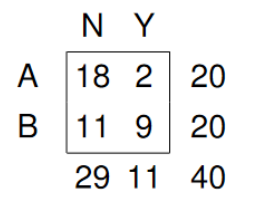
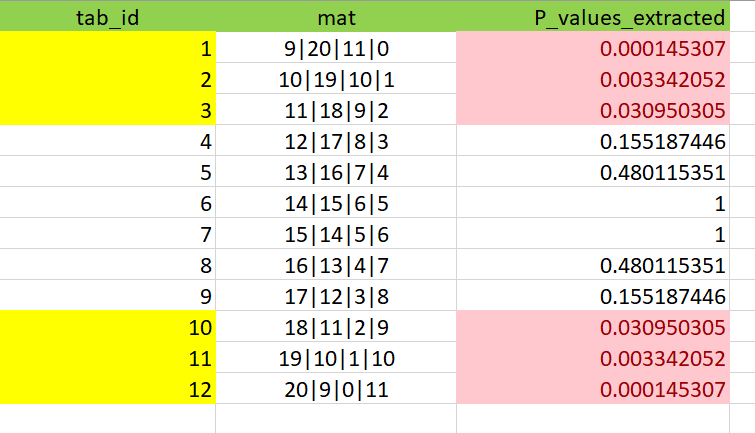
I would like to kindly ask you if is it a way to select all generated tables that are connected with p-values (from fisher exact test) that are lower than alpha = 0.05 ? As it states here: The Fisher-exact P value corresponds to the proportion of values of the test statistic that are as extreme (i.e., as unusual) or more extreme than the observed value of that test statistic ( https://www.pnas.org/content/117/32/19151). So basically I would like to select 2x2 tables like those ones marked with red to see what could be regarded as or more extreme than 18,11,2,9 table ( the observed data).
,
kind regards,
Andrzej
I am a bit struggle with extracting p.values from this nested list, I tried:
marg_combos[[3]][[1]][[1]]
which extracts a single p.value, and then I would like to extract all p-values and bind it to tab_id variable.
Any ideas will be greatly appreciated.
I tried stubbornly:
marg_combos_2 <- sapply(marg_combos[[3]],"[[", 'p.value') %>% as.data.frame()

sapply(marg_combos[[3]],"[[", 'p.value', drop=FALSE)

marg_combos_3 <- cbind(marg_combos, marg_combos_2)

colnames(marg_combos_3$.) <- "P_values_extracted"

names(marg_combos_3)

colnames(marg_combos_3)[which(names(marg_combos_3) == ".")] <- "P_values_extracted"

marg_combos_4 <-  marg_combos_3 %>% select(1,2,4)

marg_combos_4 %>%
  rowwise() %>%
  mutate_if(is.list, ~paste(unlist(.), collapse = '|')) %>%
  write.csv('marg_combos_4_final.csv', row.names = FALSE)
Key to the solutions was this:
marg_combos[[3]],"[[", 'p.value'
I have done it by many trial and error attempts.
And then in Excel straightaway:
Maybe someone could propose a simpler solution or with purrr more efficient one ?
I was stuck a bit when it came to get to a deeper elements of nested list.
marg_combos$pval <- purrr::map_dbl(marg_combos$fisher,
                                   ~ .$`p.value`)
marg_combos$flatmat <- map_chr(marg_combos$mat,~paste0(.x,collapse="|"))
select(ungroup(marg_combos),
       tab_id,flatmat,pval)
# A tibble: 12 x 3
   tab_id flatmat        pval
    <int> <chr>         <dbl>
 1      1 9|20|11|0  0.000145
 2      2 10|19|10|1 0.00334
 3      3 11|18|9|2  0.0310
 4      4 12|17|8|3  0.155
 5      5 13|16|7|4  0.480
 6      6 14|15|6|5  1
 7      7 15|14|5|6  1
 8      8 16|13|4|7  0.480
 9      9 17|12|3|8  0.155
10     10 18|11|2|9  0.0310
11     11 19|10|1|10 0.00334
12     12 20|9|0|11  0.000145