Good day!
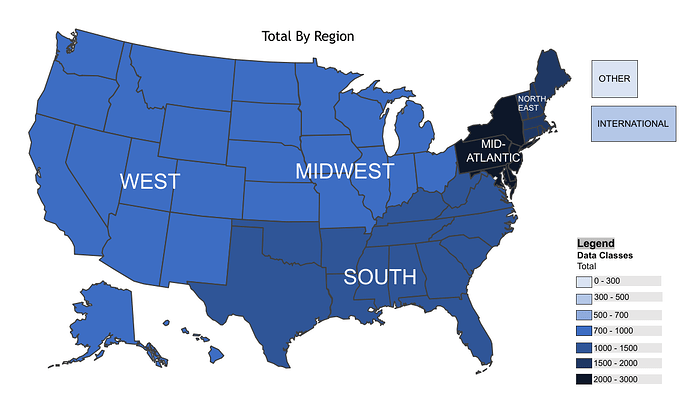
I would like to create a choropleth map with R using USA regions as the boundaries. Here is an example created in PowerPoint:
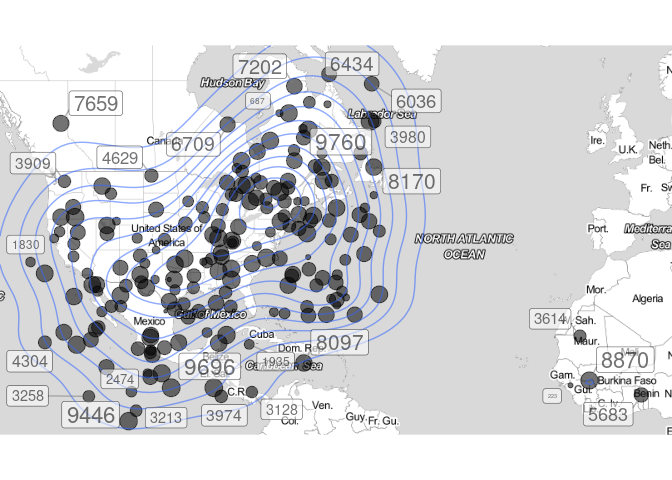
This is what I could acchieve with qmplot:
library(tidyverse)
library(ggmap)
library(ggrepel)
data <- tibble::tribble(
                  ~lon,       ~lat,
            -98.133208, 11.4326077,
            -89.552784,  11.634501,
           -62.2766186, 44.5090949,
           -65.3279894, 33.1067754,
           -67.7095365, 44.6294348,
            -96.552784,  35.634501,
           -97.3279093, 29.7724417,
           -82.6363869, 28.2949194,
           -80.2061931, 46.0133808,
            -72.014118, 32.4681642,
           -76.2531465, 47.3666368,
           -82.1650991, 46.7758541,
             -5.696645,  11.945587,
           -112.707349, 38.5205043,
           -63.0884036, 52.3930959,
            -87.128901, 39.1242719,
           -65.1626756, 31.3463503,
           -94.3254958, 40.3274999,
             -98.56121, 42.5770056,
          -115.4429944, 46.1502862,
          -117.7901088, 30.6913751,
           -63.7389596, 54.6584068,
          -109.1147095, 24.2156978,
          -119.8340735, 22.6832497,
          -117.8780275, 37.7311394,
           -67.1763467, 38.5861576,
           -96.4427769,   25.14644,
           -78.0814292, 15.5386936,
           -74.4185584, 34.5834425,
           -77.4185584, 36.5834425,
           -79.4185584, 37.5834425,
            -63.121085, 33.9241038,
            -88.121085, 41.9241038,
          -112.7260713,  40.836309,
            -90.552784,  30.634501,
           -109.552784,  12.634501,
           -73.9224329, 48.6153549
          )

data <-
  data %>% sample_n(200, replace = TRUE) %>% mutate(
    total = round( runif(nrow(.), min = 100, max = 10000), digits = 0) ,
    lon =  lon + round( runif(nrow(.), min = -10, max = 10), digits = 0),
    lat =  lat + round( runif(nrow(.), min = -10, max = 10), digits = 0)
  )

qmplot(x = lon, y = lat, data = data, maptype = "toner-lite", legend = "topleft" , alpha = .3,geom = c("point","density2d"), size = total)+ theme(legend.position = "none")+
  geom_label_repel(aes(label=total),
                  box.padding   = 0.35,
                  point.padding = 0.5,
                  segment.color = 'grey50')
#> Using zoom = 3...
#> Map tiles by Stamen Design, under CC BY 3.0. Data by OpenStreetMap, under ODbL.
#> Warning in min(x): no non-missing arguments to min; returning Inf
#> Warning in max(x): no non-missing arguments to max; returning -Inf
#> Warning in min(x): no non-missing arguments to min; returning Inf
#> Warning in max(x): no non-missing arguments to max; returning -Inf
#> Warning: ggrepel: 174 unlabeled data points (too many overlaps). Consider
#> increasing max.overlaps

Created on 2021-09-16 by the reprex package (v2.0.1)
Any suggestions?
Thank you very much.
André


