library(fpp3)
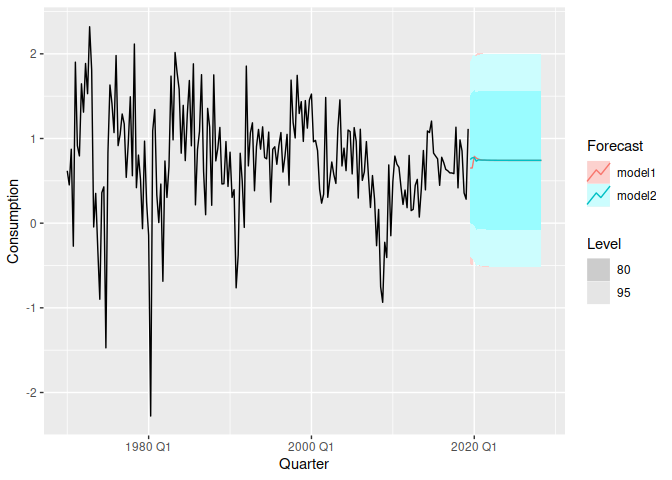
us_change %>%
model(model1 = ARIMA(Consumption ~ PDQ(0,0,0)),
model2 = ARIMA(Consumption ~ PDQ(1,0,0))) %>%
forecast(h = 36) %>%
autoplot(us_change) +
guides(
colour = guide_legend(title = "Forecast"),
fill = guide_legend(title = "Forecast")
) +
labs(level = "Level")
Created on 2020-11-26 by the reprex package (v0.3.0)