I'm trying to figure out how to specify y axis ranges for individual facets when using facet_wrap(). Any help is much appreciated.
I don't think there is a built in way to adjust the y axes manually if scales = "free_y" does not get you what you want. I can imagine adding dummy points to a plot to force scale changes, but that would be very fiddly. Can you give more details about your plot?
Thanks for your reply. The other plots are not a problem, but one maps the percentage of the earth's non-ice covered land adapted to human use in a time series from 1880 projected out to 2080. The value never gets above 40%, so ggplot() doesn't extend the y axis beyond that, whereas I'd like it to go from 0% to 100%.
Here is an example of adding a dummy point to force the y scale of one facet to have a higher maximum.
DF <- data.frame(Type = c("A","A","A","P","P","P"),
Year = c(2019,2020,2021,2019,2020,2021),
Value = c(1,2,3,0.1,0.2,0.4))
library(ggplot2)
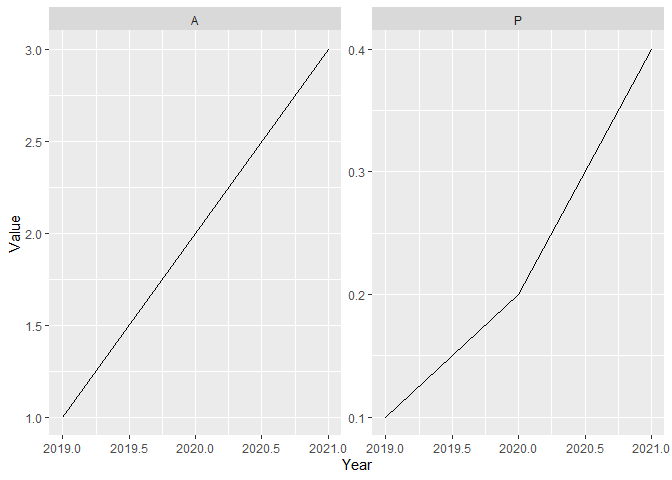
ggplot(DF, aes(Year, Value)) + geom_line() +
facet_wrap(~Type, scales = "free_y")
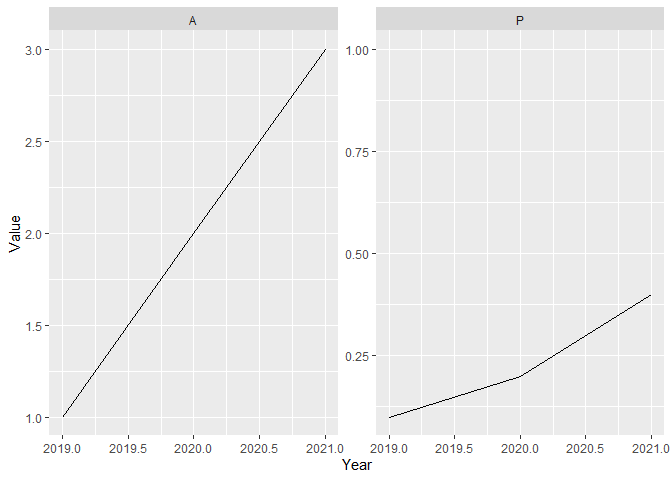
#add dummy point with transparency set to 0
DF2 = data.frame(Type = "P", Year = 2021, Value = 1)

ggplot(DF, aes(Year, Value)) + geom_line() +
  geom_point(data = DF2, alpha = 0) +
  facet_wrap(~Type, scales = "free_y")
Created on 2023-03-18 with reprex v2.0.2
This topic was automatically closed 21 days after the last reply. New replies are no longer allowed.
If you have a query related to it or one of the replies, start a new topic and refer back with a link.