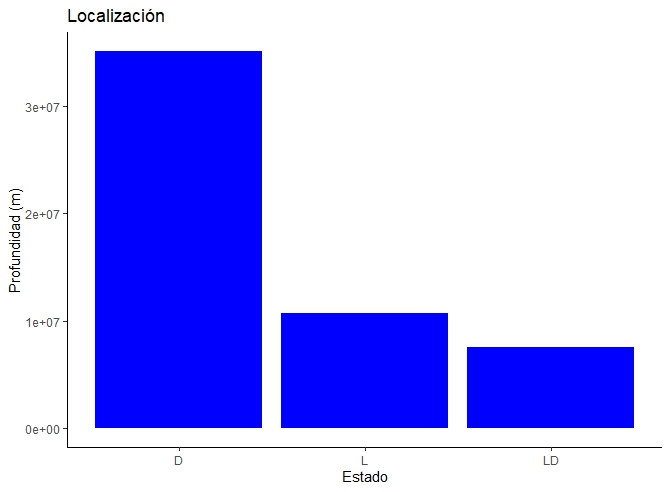
The "Profundidad " data reaches up to 7280 meters. I don't know why it puts those values on my y axis.
The code I used is the following: ggplot(foramtotal, aes(assemblage, depth)) +geom_bar("identity", fill="blue") + ggtitle ("Localización") + ylab("Profundidad (m)") + xlab ("Estado") theme_classic() .
The assemblage variable is chr and depth is numeric.
What can I do to make my y-axis correctly follow the values between 0 and 7280 meters?
# Maybe if you divide the y axis between 1000
ggplot(foramtotal, aes(assemblage, depth/1000)) +geom_bar("identity", fill="blue") + ggtitle ("Localización") + ylab("Profundidad (m)") + xlab ("Estado") theme_classic()