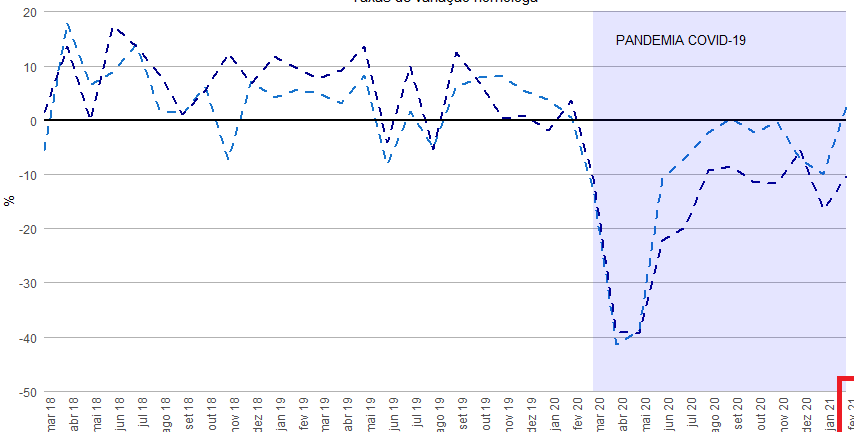
In the lower right corner the legend is cutted. How can I avoid this?
Try expanding your x axis a little bit.
If you need more specific help, please provide a proper REPRoducible EXample (reprex) illustrating your issue.
And how can expand my x axis a little bit?
Use the expand argument in the scale_x_date() function.
As I said, if you need specific help, post a reprex.
1 Like
I solved the problem with this code
scale_x_date( date_breaks = "1 month", date_labels = "%b %y", expand = c(0, 0))
This topic was automatically closed 7 days after the last reply. New replies are no longer allowed.
If you have a query related to it or one of the replies, start a new topic and refer back with a link.