Good morning,
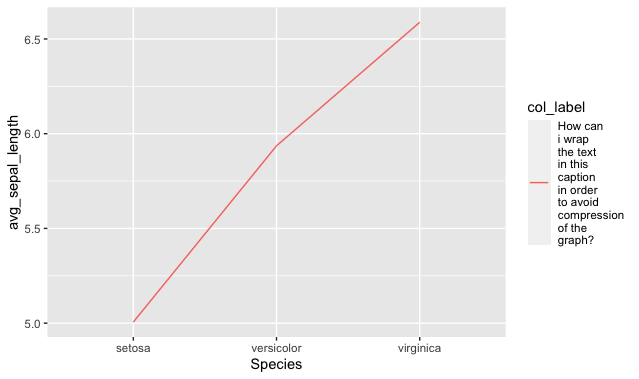
I have a problem similar to this one in a plot that i have made. In this example, I have purposely exaggerated the compression of the graph due to the caption:
iris %>%
group_by(Species) %>%
mutate(avg_sepal_length = mean(Sepal.Length)) %>%
ggplot(aes(x = Species)) +
geom_line(aes(y = avg_sepal_length, color = "How can i wrap the text in this caption in order to avoid compression of the graph?"), group = 1)
I would like to ask if someone can help me wrap the text in order to avoid such a compression of the plot.
Thank You for the help.
you can place line breaks with \n
Here is an example of replacing ALL spaces with \n
library(tidyverse)

(color_label <- stringr::str_replace_all(string =
"How can i wrap the text in this caption in order to avoid compression of the graph?",
pattern = " ", replacement = "\n"))

iris %>%
  group_by(Species) %>%
  mutate(avg_sepal_length = mean(Sepal.Length)) %>%
  ggplot(aes(x = Species)) +
  geom_line(aes(y = avg_sepal_length, color = color_label), group = 1)
You could also use str_wrap to automatically wrap lines that exceed a given number of characters. In the example below, I've used a width of 10 characters, but you can of course set this to any desired width.
library(tidyverse)

col_label = str_wrap("How can i wrap the text in this caption in order to avoid compression of the graph?", 10)

iris %>%
  group_by(Species) %>%
  mutate(avg_sepal_length = mean(Sepal.Length)) %>%
  ggplot(aes(x = Species)) +
  geom_line(aes(y = avg_sepal_length, color = col_label), group = 1)