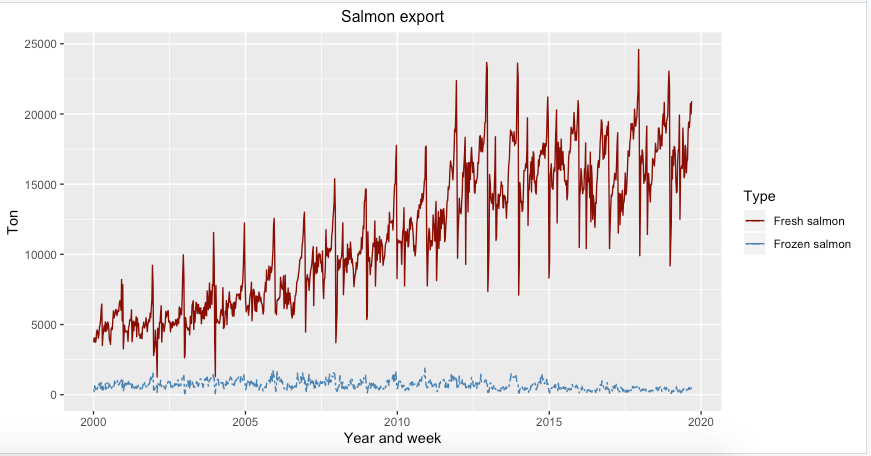
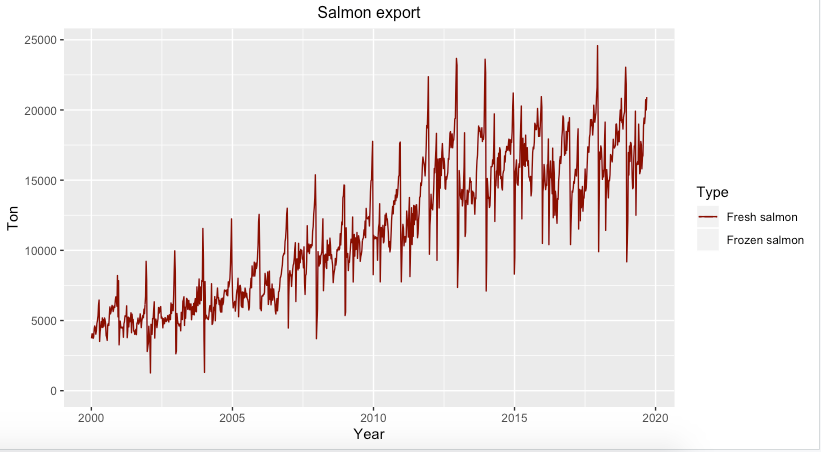
I decided to go back to edit the label "Year and week" to only "Year", but now I can't get the second blue line to work at all with the exact same script? I'm very confused.
I get this warning message:
1: Removed 3 rows containing missing values (geom_path).
2: Removed 1026 rows containing missing values (geom_path).
Previously it only removed 3 values which were fine, but now it's removing literally all the rows as there are 1026 obs. in this data. It looks like this now with the exact same script:
There is nothing evident in your code, we are going to need sample data (on a copy paste friendly format) that reproduces the issue or a link to the xlsx file you are using.
This is how it looks. It's basically year 2000-2019 with 52/53 weeks in every year that adds up to 1026 weeks. Thing is it was working just fine before so I'm not sure how the data would've changed.
Maybe you performed some data cleaning step in your previous R session that you have forgot to include in your script and that is why isn't working now, but to be able to help you we are going to need sample data that reproduces your issue, not a str() print, please try to provide a REPRoducible EXample (reprex)
As @andresrcs suggested, it seems likely that you had a slightly different color vector active in your last session (maybe due to working on the plot).