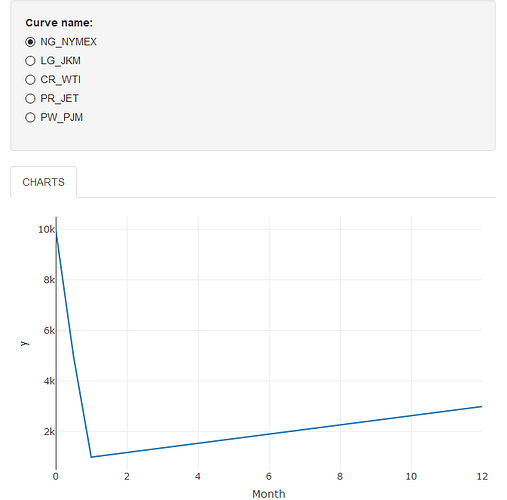
Hello PJ,
Thank you for this. It helped me advance. I fear I did not provide enough of my code to allow you to offer the complete solution to my problem, apologies. So I still get an error message when the routine tries to plot: ".y must be a vector, not a reactiveExpr/reactive/function object". Here is the full code.
#
# v 1.0 mb 042921
# VaR_Scenario_Analysis_R_Code.R
#
# R Code to illustrate Interface for VaR Scenario Analysis Tool
#


library(shiny)
library(plotly)
library(purrr)


#z_curve <- "NG_NYMEX"

z_curves_expos_delta <-
  data.frame(
    Tenor = c("SPOT", "BALM", "PRPT", "1_YR"),
    Month = c(0, 0.5, 1, 12),
    NG_NYMEX = c(10000, 5000, 1000, 3000),
    LG_JKM = c(1000, 7000, 1000, 4000),
    CR_WTI = c(8000, 4000, 2500, 1000),
    PR_JET = c(6000, 3000, 4500, 2000),
    PW_PJM = c(9000, 7000, 4500, 2000)
  )


ui <- fluidPage(
  titlePanel("POC for Interface - QP VaR Scenario Analysis - CRMS in Shell T&S"),

  textOutput("a_curve"),
  textOutput("selected_var"),

  sidebarLayout(
    sidebarPanel(
      # Input: Select the random distribution type ----
      radioButtons(
        "curve",
        "Curve name:",
        c(
          "NG_NYMEX" = "NG_NYMEX",
          "LG_JKM" = "LG_JKM",
          "CR_WTI" = "CR_WTI",
          "PR_JET" = "PR_JET",
          "PW_PJM" = "PW_PJM"
        ),
        selected = "NG_NYMEX"
      ),

      radioButtons(
        "ad-hoc_scenario",
        "Ad-Hoc Scenario:",
        c(
          "Target levels specified by drawing in chart" = "chart",
          "Target levels specified by typing in table" = "table"
        )
      ),

      radioButtons(
        "date-range_scenario",
        "Date Range Scenario:",
        c("Target levels based on changes between 2 past dates" = "past_dates")
      ),

      dateRangeInput("daterange1", "Date range:",
                     start = "2001-01-01",
                     end   = "2021-04-28"),

      radioButtons(
        "preset_scenario",
        "Preset Scenario:",
        c(
          "Polar Vortex 2021" = "preset_Vortex-2021",
          "Hurricane Harvey" = "preset_Harvey",
          "Gulf War" = "preset_Gulf"
        )
      ),
    ),
    mainPanel(tabsetPanel(
      type = "tabs",

      tabPanel(
        "CHARTS",
        fluidRow(
          column(4, plotlyOutput("p_expoD"))
        )
      ),

      tabPanel(
        "TABLES",
        fluidRow(
          column(4, tableOutput("table_expoD"))
        )
      ),
      tabPanel("CORRELATIONS")

    ))
  )
  ,
  tags$head(tags$style(
    HTML('* {font-family: "Arial"; font-size: 12px;};')
  ))
)


server <- function(input, output, session) {
  ####################### CURVE NAME SELECTION - START #######################
  #
  # Code works if I set "z_curve" specifically like in line below but not if set via Radio Button as Reactive Value
  # z_curve <- "NG_NYMEX"

  zz_curve <- reactive({
    input$curve
  })
  output$a_curve <- renderText({
    paste("You chose", zz_curve())
  })


  #Reactive dataframe based off input selection
  z_exposD <-
    reactive({
      tmp <- z_curves_expos_delta %>% select(input$curve)
      return(tmp)
    })


  ####################### CURVE NAME SELECTION - END #######################


  ####################### CURVE DATA SELECTION - START #######################

  # Code works if I set "z_exposD" specifically like in line below but not if set it via Radio Button as Reactive Value
  #z_exposD <- z_curves_expos_delta[, z_curve]

  z_tenors <- z_curves_expos_delta$Tenor
  z_months <- z_curves_expos_delta$Month
  ####################### CURVE DATA SELECTION - END #######################


  ####################### EXPOSURES DELTA - START #######################
  rv_expoD <- reactiveValues(x = z_months,
                             y = z_exposD)
  grid_expoD <- reactive({
    data.frame(x = seq(min(rv_expoD$x), max(rv_expoD$x), length = 10))

  })

  #  model_expoD <- reactive({
  #    d <- data.frame(x = rv_expoD$x, y = rv_expoD$y)
  #    loess(y ~ x, d)
  #  })


  output$p_expoD <- renderPlotly({
    # creates a list of circle shapes from x/y data
    circles <- map2(
      rv_expoD$x,
      rv_expoD$y,
      ~ list(
        type = "circle",
        # anchor circles at (mpg, wt)
        xanchor = .x,
        yanchor = .y,
        # give each circle a 2 pixel diameter
        x0 = -4,
        x1 = 4,
        y0 = -4,
        y1 = 4,
        xsizemode = "pixel",
        ysizemode = "pixel",
        # other visual properties
        fillcolor = "blue",
        line = list(color = "transparent")
      )
    )


    fig <- plot_ly(source = "fig_expoD") %>%
      add_markers(
        x = z_months,
        y = z_exposD,
        color = I("green"),
        name = "exposures Delta"
      )

    #    fig <- fig %>%  add_lines(x = grid()$x, y = predict(loess(y ~ x, data.frame(x = z_months, y = z_exposD) ), grid()), color = I("green"), name = "original")
    #    fig <- fig %>% add_trace(x = grid()$x, y = predict(model(), grid()), color = I("red"), mode = "markers+lines", name = "scenario")

    fig <-
      fig %>% add_bars(
        x = rv_expoD$x,
        y = rv_expoD$y,
        color = I("red"),
        mode = "markers+bars",
        name = "scenario"
      )

    fig <-
      fig %>% add_bars(
        x = z_months,
        y = z_exposD,
        color = I("green"),
        name = "originals"
      )


    fig <-
      fig %>% layout(shapes = circles) %>% config(edits = list(shapePosition = TRUE))

    fig


  })

  data_expoD <- reactive({
    d <-
      data.frame(Deltas = rv_expoD$x,
                 Original = z_exposD,
                 Scenario = rv_expoD$y)
    d
  })

  output$table_expoD <- renderTable({
    data_expoD()
  })


  # update x/y reactive values in response to changes in shape anchors
  observe({
    ed <- event_data("plotly_relayout", source = "fig_expoD")
    shape_anchors <- ed[grepl("^shapes.*anchor$", names(ed))]
    if (length(shape_anchors) != 2)
      return()
    row_index <-
      unique(readr::parse_number(names(shape_anchors)) + 1)
    pts <- as.numeric(shape_anchors)
    rv_expoD$x[row_index] <- pts[1]
    rv_expoD$y[row_index] <- pts[2]

  })

  ####################### EXPOSURES DELTA - END #######################


}

shinyApp(ui, server)

