Will I need to buy a plan? (I'm hoping the answer is No!) Using the Shiny App free plan.

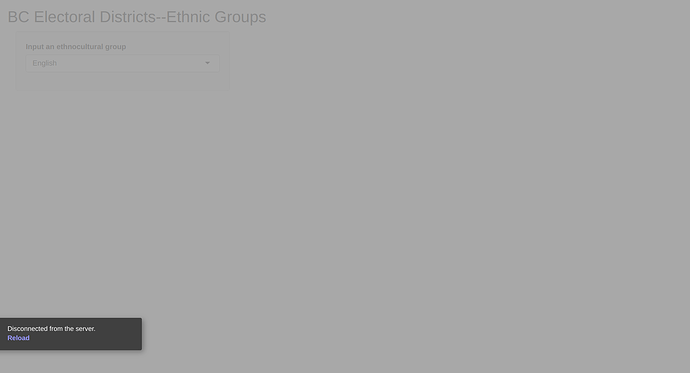
Hello, I've set up and been toying around with a Shiny App. Basically, my app opens up a leaflet map, and adds markers onto it with some data. This is a screenshot of what it looks like after deployment:

As you can see, the leaflet simply does not render. It does render when I launch the app from my laptop however.

The log from the ShinyApps settings dashboard shows no indication of anything being wrong:

2025-01-17T03:29:23.936608+00:00 shinyapps[13728694]: RJSONIO version: (none)
2025-01-17T03:29:23.941345+00:00 shinyapps[13728694]: htmltools version: 0.5.8.1
2025-01-17T03:29:23.945979+00:00 shinyapps[13728694]: reticulate version: (none)
2025-01-17T03:29:23.950678+00:00 shinyapps[13728694]: Using pandoc: /opt/connect/ext/pandoc/2.16
2025-01-17T03:29:23.956494+00:00 shinyapps[13728694]:
2025-01-17T03:29:23.961381+00:00 shinyapps[13728694]: Starting R with process ID: '31'
2025-01-17T03:29:23.966432+00:00 shinyapps[13728694]: Shiny application starting ...
2025-01-17T03:29:23.971253+00:00 shinyapps[13728694]: Linking to GEOS 3.10.2, GDAL 3.4.1, PROJ 8.2.1; sf_use_s2() is TRUE
2025-01-17T03:29:23.975900+00:00 shinyapps[13728694]: terra 1.8.10
2025-01-17T03:29:23.982108+00:00 shinyapps[13728694]: Loading required package: sp
2025-01-17T03:29:23.986856+00:00 shinyapps[13728694]: Please note that rgdal will be retired during October 2023,
2025-01-17T03:29:23.991546+00:00 shinyapps[13728694]: plan transition to sf/stars/terra functions using GDAL and PROJ
2025-01-17T03:29:23.996511+00:00 shinyapps[13728694]: at your earliest convenience.
2025-01-17T03:29:24.001551+00:00 shinyapps[13728694]: See sp evolution status: examples of migration from retiring packages and GitHub - r-spatial/evolution: Preparing CRAN for the retirement of rgdal, rgeos and maptools
2025-01-17T03:29:24.006370+00:00 shinyapps[13728694]: rgdal: version: 1.6-7, (SVN revision 1203)
2025-01-17T03:29:24.011730+00:00 shinyapps[13728694]: Geospatial Data Abstraction Library extensions to R successfully loaded
2025-01-17T03:29:24.016678+00:00 shinyapps[13728694]: Loaded GDAL runtime: GDAL 3.4.1, released 2021/12/27
2025-01-17T03:29:24.021453+00:00 shinyapps[13728694]: Path to GDAL shared files: /usr/share/gdal
2025-01-17T03:29:24.026085+00:00 shinyapps[13728694]: GDAL binary built with GEOS: TRUE
2025-01-17T03:29:24.030949+00:00 shinyapps[13728694]: Loaded PROJ runtime: Rel. 8.2.1, January 1st, 2022, [PJ_VERSION: 821]
2025-01-17T03:29:24.035629+00:00 shinyapps[13728694]: Path to PROJ shared files: /home/shiny/.local/share/proj:/usr/share/proj
2025-01-17T03:29:24.040344+00:00 shinyapps[13728694]: PROJ CDN enabled: TRUE
2025-01-17T03:29:24.045377+00:00 shinyapps[13728694]: Linking to sp version:2.1-4
2025-01-17T03:29:24.050451+00:00 shinyapps[13728694]: To mute warnings of possible GDAL/OSR exportToProj4() degradation,
2025-01-17T03:29:24.057091+00:00 shinyapps[13728694]: use options("rgdal_show_exportToProj4_warnings"="none") before loading sp or rgdal.
2025-01-17T03:29:24.061916+00:00 shinyapps[13728694]:
2025-01-17T03:29:24.066805+00:00 shinyapps[13728694]: Attaching package: ‘rgdal’
2025-01-17T03:29:24.071708+00:00 shinyapps[13728694]:
2025-01-17T03:29:24.076349+00:00 shinyapps[13728694]: The following object is masked from ‘package:terra’:
2025-01-17T03:29:24.080874+00:00 shinyapps[13728694]:
2025-01-17T03:29:24.086428+00:00 shinyapps[13728694]: project
2025-01-17T03:29:24.092363+00:00 shinyapps[13728694]:
2025-01-17T03:29:24.096996+00:00 shinyapps[13728694]: Reading layer FED_A_FINAL_REPORT_BC' from data source 2025-01-17T03:29:24.105008+00:00 shinyapps[13728694]: /srv/connect/apps/ethnocultural_origins_in_bc/shapes_feds/BC/SHAPEFILE/FED_A_FINAL_REPORT_BC.shp'
2025-01-17T03:29:24.109674+00:00 shinyapps[13728694]: using driver ESRI Shapefile' 2025-01-17T03:29:24.114467+00:00 shinyapps[13728694]: Simple feature collection with 43 features and 7 fields 2025-01-17T03:29:24.119430+00:00 shinyapps[13728694]: Geometry type: POLYGON 2025-01-17T03:29:24.131067+00:00 shinyapps[13728694]: Dimension: XY 2025-01-17T03:29:24.137340+00:00 shinyapps[13728694]: Bounding box: xmin: 3658201 ymin: 1709522 xmax: 4723366 ymax: 3539818 2025-01-17T03:29:24.142165+00:00 shinyapps[13728694]: Projected CRS: PCS_Lambert_Conformal_Conic 2025-01-17T03:29:32.849610+00:00 shinyapps[13728694]: 2025-01-17T03:29:32.854395+00:00 shinyapps[13728694]: Listening on http://127.0.0.1:42511 2025-01-17T03:29:34.843074+00:00 shinyapps[13728694]: Reading layer FED_A_FINAL_REPORT_BC' from data source
2025-01-17T03:29:34.848065+00:00 shinyapps[13728694]: /srv/connect/apps/ethnocultural_origins_in_bc/shapes_feds/BC/SHAPEFILE/FED_A_FINAL_REPORT_BC.shp' 2025-01-17T03:29:34.852853+00:00 shinyapps[13728694]: using driver ESRI Shapefile'
2025-01-17T03:29:34.857495+00:00 shinyapps[13728694]: Simple feature collection with 43 features and 7 fields
2025-01-17T03:29:34.862418+00:00 shinyapps[13728694]: Geometry type: POLYGON
2025-01-17T03:29:34.867246+00:00 shinyapps[13728694]: Dimension: XY
2025-01-17T03:29:34.872135+00:00 shinyapps[13728694]: Bounding box: xmin: 3658201 ymin: 1709522 xmax: 4723366 ymax: 3539818
2025-01-17T03:29:34.877070+00:00 shinyapps[13728694]: Projected CRS: PCS_Lambert_Conformal_Conic

Here is a list of the things which I have tried:

  1. Ensured that all paths are contained within the app's folders.
  2. Ensured that the file names are all within the correct length
  3. I have maximized whatever I could find in the app's settings--eg, the StartupTimeout
  4. I have also updated all of the packages in my R installation.

The size of the files on my computer is ~490 MB. Could this be the source of the problem? Is there a way around it without having to pay?

Many thanks!
While it is difficult to troubleshoot an unknown piece of code just from the error messages I notice from your output that you are attaching package {rgdal}, most likely to read a piece of spatial data.

The rgdal package has been archived from CRAN, which is somewhat of a reproducibility issue. Its use is no longer considered a best practice - for more info see the linked pages on r-spatial.org and github.com from your error log.

While I can not guarantee that this is the only problem with your shiny app you should strongly consider rewriting it using more current set of packages, namely {sf} for spatial data ingest and manipulation.

Many thanks @jlacko for your hint--it helped, I suppose, because, the map did render but it continues to give me the "disconnected from server" in < 1 second. Apologies for not earlier attaching the code, I could see some people at least getting their questions answered by simply posting the logs from the server. I have copied all of my code below. I would be grateful for any feedback.

#When working properly, this Shiny app gives the user a chance to select one ethnocultural group, self identified
# from the 2021 census, and to highlight how many of each group lived within a specific riding ("Federal Electoral District")

library(shiny)
library(leaflet)
library(htmltools)
library(openxlsx)
library(sf)
library(terra)
library(rstudioapi)

ethnoculturalgroups = as.vector(read.xlsx("data_here/list_of_nationalities.xlsx"))


##This is the back-up script to the Shiny App highlighting the distribution of different "ethnocultural" groups
#across the Federal Electoral Districts (FEDs) in BC. 

#This will make it easier to carry the data files/code around from one directory to another
#current_directory = dirname(rstudioapi::getSourceEditorContext()$path)
#setwd(current_directory)


#Read in the map with the federal electoral districts
#Note that this map can be found here: 
bc_fed_nova = sf::st_read("shapes_feds/BC/SHAPEFILE/FED_A_FINAL_REPORT_BC.shp")
#We need to project it properly and add points for longitude and latitude
#The longitude/latitude pairs for each polygon become the site of the markers 
bc_fed_nova = sf::st_transform(bc_fed_nova, 4326)
bc_centroids = data.frame(st_coordinates(st_centroid(bc_fed_nova$geometry)))
bc_fed_nova$X = bc_centroids[,1]
bc_fed_nova$Y = bc_centroids[,2]


#We need to import the census data for BC 
census_data_BC = openxlsx::read.xlsx("data_here/BC_census_data.xlsx")
#Let's use a "copy" just in case
census_data_BC_copy = census_data_BC


#We need this table to be here as an intermediate step to be able to bind the column names from the map and the census data
updated_table = openxlsx::read.xlsx("data_here/References2.xlsx")
colnames(updated_table)[3] = "ED_NAMEE"
#The next step was done separately for the original census data
updated_table$NamesInCensus = str_remove_all(updated_table$NamesInCensus, " ")
colnames(updated_table)[2] = "FED"
colnames(census_data_BC_copy)[5] = "FED"

#Now we bring the two references together: the names of the FEDs + the census data by riding
census_data_BC_copy = dplyr::left_join(census_data_BC_copy, updated_table, by = "FED")


#We need a function which will return the combined data + map to the user of the app
#First to extract the right group, then to bind that data to the 
extract_bind_specific_group <- function(nationalgroup, mapdatainput)
{
  #"nationalgroup" is the name of an ethnic category
  #"mapdatainput" 
  extracted_group = census_data_BC_copy[which(census_data_BC_copy$V10 == nationalgroup),]
  #We ensure that the extracted group has the correct names by doing this
  extracted_group = dplyr::left_join(extracted_group, updated_table, by = "ED_NAMEE")
  mapdataoutput = dplyr::left_join(mapdatainput, extracted_group, by = "ED_NAMEE")
  return(mapdataoutput)
  print("A data map is born")
}

extracted_group = extract_bind_specific_group("Lebanese", mapdatainput = bc_fed_nova)


#The second function is just a way to get to the first, but it takes the result mapdataouput
# and creates a new column which 
print_out_attach_messages <- function(nationalgroupB, mapdatainputB)
{
  extracted_data = extract_bind_specific_group(nationalgroup = nationalgroupB, mapdatainput = mapdatainputB)
  
  extracted_data$MESSAGE = NULL 
  for(i in 1:nrow(extracted_data))
  {
    extracted_data$MESSAGE[i] = paste("In 2021, the number of people who defined their ethnicity as ", nationalgroupB, "in the district of ", extracted_data$ED_NAMEE[i], " was ", extracted_data$V12[i])
  }
  
  #print(extracted_data$MESSAGE)
  return(extracted_data)
}


# Define UI for application that draws a histogram
ui <- fluidPage(
    # Application title
    titlePanel("BC Electoral Districts--Ethnic Groups"),
    
    #The user of the app selects the ethnocultural group to look up, here 
    sidebarPanel(
      selectizeInput(
        inputId = "selectedethnogroup",
        label = "Input an ethnocultural group", 
        choices = ethnoculturalgroups,
        selected = NULL, 
        multiple = FALSE, 
        width = '100%', 
        options = list(
          'plugins' = list('remove_button'),
          'create' = TRUE,
          'persist' = TRUE
        )
      )
    ),
    
    mainPanel(leafletOutput("BCFEDS", width = "750px", height = "500px"))
    
)


# Define server logic required to draw a histogram
server <- function(input, output) {
  
  output$BCFEDS <- renderLeaflet(
    {
      #Moving the logic over here
     
      #source("support_file_for_app.R")$value
      
      #Find what the user input is and use it to create a dataframe which has the distributions of the selected naitonal 
      #group across FEDs in British Columbia
      keyhere = input$selectedethnogroup
      #See the function in the source file 
      #For the purposes of this question, I have attached the definition of the function below. 
      extracted_group_map = extract_bind_specific_group(nationalgroup = keyhere, mapdatainput = bc_fed_nova)
    
      #The standard code for a leafleft map
      BCFEDS <- leaflet()
      BCFEDS <- addTiles(BCFEDS)
      BCFEDS <- setView(BCFEDS, lng = -122.8, lat = 49.3, zoom = 8)
      BCFEDS <- addPolygons(data = extracted_group_map, map = BCFEDS)
      BCFEDS <- addMarkers(map = BCFEDS, lng = extracted_group_map$X , lat = extracted_group_map$Y, 
                           popup =  paste("In the 2021 census, the number of people self identifying as", keyhere, "in the district of ", extracted_group_map$ED_NAMEE, "was ", extracted_group_map$V12 ))
    }
  )

}

# Run the application 
shinyApp(ui = ui, server = server)


#This is how I define the function which is being called 
#The function returns a new map where V12 includes the numbers of people belonging to a 
# specific cultural group within a given federal electoral district

extract_bind_specific_group <- function(nationalgroup, mapdatainput)
{
  #"nationalgroup" is the name of an ethnic category
  #"mapdatainput" 
  extracted_group = census_data_BC_copy[which(census_data_BC_copy$V10 == nationalgroup),]
  #We ensure that the extracted group has the correct names by doing this
  extracted_group = dplyr::left_join(extracted_group, updated_table, by = "ED_NAMEE")
  mapdataoutput = dplyr::left_join(mapdatainput, extracted_group, by = "ED_NAMEE")
  return(mapdataoutput)
  print("A data map is born")
}