Hey there,
I made the following flexdashboard and technically it's working: https://dashboards.marktforschung-schmidl.at/eine-frage-01/
I just have styling problems now. The ggplot in RStudio looks like this:
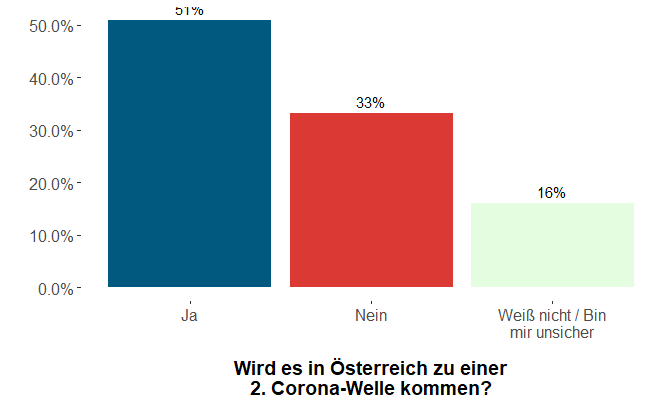
But as you can see the font sizes don't carry over to the flexdashboard.
Also I would like the bottom columns to be evenely spread out. I looked around the internet but couldn't find a solution. Any help would be great.
Here is my code:
---
title: "Eine Frage: 2. Corona-Welle?"
output:
  flexdashboard::flex_dashboard:
    orientation: rows
    vertical_layout: scroll
runtime: shiny
---

<style>

body {
  padding-top:0px
}

.navbar{
  visibility: hidden
}

</style>


```{r global, include=FALSE, autodep=TRUE, cache=FALSE}
library(limer)
library(sjlabelled)
library(sjmisc)
library(shiny)
library(shinyWidgets)
library(knitr)
library(kableExtra)
library(ggplot2)


options(lime_api = 'linkt o my api')
options(lime_username = 'username')
options(lime_password = 'password')

get_session_key()

get_new_data <- function(){
  data <- get_responses(871587, sLanguageCode = "de", sResponseType = "short")
  return(data)
}

data <- get_new_data()


update_data <- function(){
    data <<- get_new_data()
  }


data$f1 <- set_label(data$f1, "Glaubst du, dass es in Österreich zu einer 2. Corona-Welle kommen wird? Also, dass die Zahl der Infektionen wieder soweit ansteigen wird, dass neue Beschränkungen notwendig werden?")
get_label(data$f1)
data$f1 <- set_labels(data$f1, labels = c("Ja", "Nein", "Weiß nicht / bin mir unsicher"))
get_labels(data$f1)

data$s1 <- set_label(data$s1, "Bundesland")
get_label(data$s1)
data$s1 <- set_labels(data$s1, labels = c("Wien", "Niederösterreich", "Burgenland", "Steiermark",
                                          "Kärnten", "Salzburg", "Tirol", "Vorarlberg",
                                          "Nicht in Österreich", "Oberösterreich"),
                      force.labels = TRUE)
get_labels(data$s1)

data$s2 <- set_label(data$s2, "Alter")
get_label(data$s2)
data$s2 <- set_labels(data$s2, labels = c("bis 19 Jahre", "20 - 29 Jahre", "30-39 Jahre",
                      "40-49 Jahre", "50-59 Jahre", "60 - 69 Jahre", "70 - 79 Jahre",
                      "80+ Jahre"), force.labels = TRUE)
get_labels(data$s2)

data$s3 <- set_label(data$s3, "Geschlecht")
get_label(data$s3)
data$s3 <- set_labels(data$s3, labels = c("weiblich", "männlich", "anderes"),
                      force.labels = TRUE)
get_labels(data$s3)

plot <- ggplot(data, aes(f1)) +
  geom_bar(aes(y = ..prop.., fill = factor(..x..)), stat="count",
           fill = c("#01597F", "#DB3A34", "#E4FDE1"), linetype = "blank") +
  geom_text(aes( label = scales::percent(..prop..),
                 y= ..prop.. ), stat= "count", vjust = -.5) +
  labs(x = "Wird es in Österreich zu einer\n2. Corona-Welle kommen?", y = "") +
  scale_y_continuous(labels = scales::percent) +
  scale_x_discrete(limits = c("Ja", "Nein", "Weiß nicht / Bin\nmir unsicher")) +
  theme(panel.grid.major = element_blank(),
        panel.grid.minor = element_blank(),
        panel.background = element_blank(),
        axis.text=element_text(size=12),
        axis.title=element_text(size=14,face="bold"),
        axis.title.x = element_text(margin = margin(t = 14, r = 0, b = 0, l = 0)))


bundesland <- frq(data$s1, sort.frq = "desc")
bundesland <- bundesland[[1]][,c(2,4)]
colnames(bundesland) <- c("", "%")
bundesland <- bundesland[1:nrow(bundesland)-1,]


alter <- frq(data$s2)
alter <- alter[[1]][,c(2,4)]
colnames(alter) <- c("", "%")
alter <- alter[1:nrow(alter)-1,]


geschlecht <- frq(data$s3)
geschlecht <- geschlecht[[1]][,c(2,4)]
colnames(geschlecht) <- c("", "%")
geschlecht <- geschlecht[1:nrow(geschlecht)-1,]
Row {data-height=500}
Ergebnisse
renderPlot({
    invalidateLater(1000, session)
    update_data()
    plot
  })
Row {data-height=310}
Bundesland (%)
renderUI({
    invalidateLater(1000, session)
    update_data()
    HTML(
        kable(bundesland, format = "html", col.names = NULL) %>% kable_styling(full_width = TRUE,
                                                     font_size = 13,
                                                     bootstrap_options = c("striped",
                                                                           "condensed",
                                                                           "responsive")
                                                     )
    )
})
Alter (%)
renderUI({
    invalidateLater(1000, session)
    update_data()
    HTML(
        kable(alter, format = "html", col.names = NULL) %>% kable_styling(full_width = TRUE,
                                                     font_size = 13,
                                                     bootstrap_options = c("striped",
                                                                           "condensed",
                                                                           "responsive")
                                                     )
    )
})
Geschlecht (%)
renderUI({
    invalidateLater(1000, session)
    update_data()
    HTML(
        kable(geschlecht, format = "html", col.names = NULL) %>% kable_styling(full_width = TRUE,
                                                     font_size = 13,
                                                     bootstrap_options = c("striped",
                                                                           "condensed",
                                                                           "responsive")
                                                     )
    )
})
TeilnehmerInnenstand:
renderText({
  invalidateLater(1000, session)
  update_data()
  nrow(data)
})