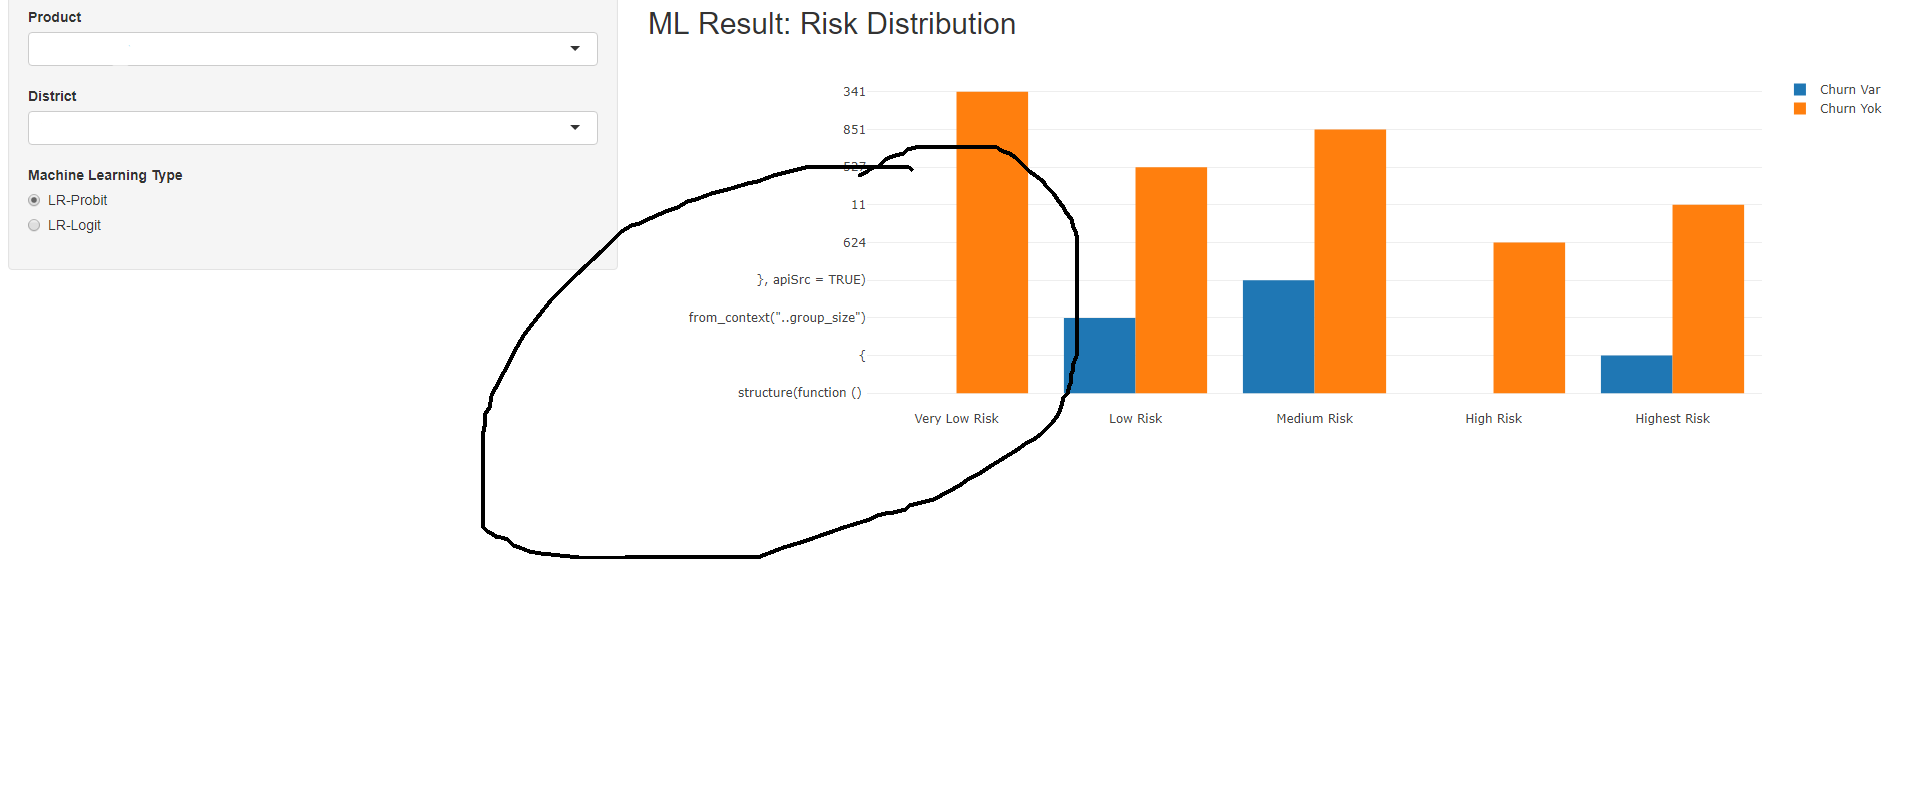
When i change product and district, R calculates regression and reflects graph via plotly. However, as you see, there are codes on the y axis of graph. Why do i face this problem? could you possible help me to solve this?
Thanks a lot your time
library(shiny)
library(plyr)
library(mfx)
library(plotly)
library(ggplot2)
library(dplyr)
library(forcats)


ui <- shinyUI(
    fluidPage(
        sidebarLayout(
            sidebarPanel(

                # Sidebar with a slider input

                selectInput("select1", "Product", choices = c("a1"="a1","a2"="a2)",
                                                              "a3"="a3","a4"="a4","a5"="a5")),

                selectInput("select2", "District",choices=c("b1"="b1","b2"="b2","b3"="b3",
                                                            "b4"="b4")),
                radioButtons(inputId = "mltype",
                             label = "Machine Learning Type",
                             choices = list("LR-Probit"="probitmfx","LR-Logit"="logitmfx")),position="right"),


            mainPanel(
                titlePanel("ML Result: Risk Distribution"),
                tabPanel("pp", plotlyOutput("Display"))
            )
        )))


library(shiny)
library(plyr)
library(mfx)
library(plotly)
library(ggplot2)
library(dplyr)
library(forcats)

server <- function(input, output) {

    ##REACTIVE FUNCTION FOR ML-PROBIT REG


    observe({
        a<-Book1 %>% filter(Urun==(input$select1) & Ilce==(input$select2))


        # add pre data manipulation here (don't add another observeEvent)
        observeEvent(input$mltype,{

            if(input$mltype=="probitmfx"){
                res <- probitmfx(formula=CHURN~ HizmetSuresi3+SikayetSayisi+TeknikDestekTalebi+MobilDataKullanimi+IndirimOrani
                                 ,data = a,
                                 atmean = TRUE, robust = FALSE, clustervar1 = NULL,
                                 clustervar2 = NULL, start = NULL, control = list())
            }
            if(input$mltype=="logitmfx"){
                res <- logitmfx(formula=CHURN~ HizmetSuresi3+SikayetSayisi+TeknikDestekTalebi+MobilDataKullanimi+IndirimOrani
                                ,data = a,
                                atmean = TRUE, robust = FALSE, clustervar1 = NULL,
                                clustervar2 = NULL, start = NULL, control = list())
            }


            res1<-as.data.frame(res$mfxest)
            pi<-select(res1,`dF/dx`,`P>|z|`)

            if (pi[1,2] < 0.05) a$HizmetSuresi3 <- a$HizmetSuresi3*pi[1,1]
            if (pi[2,2] < 0.05) a$SikayetSayisi <- a$SikayetSayisi*pi[2,1]
            if (pi[3,2] < 0.05) a$TeknikDestekTalebi <- a$TeknikDestekTalebi*pi[3,1]
            if (pi[4,2] < 0.05) a$MobilDataKullanimi <- a$MobilDataKullanimi*pi[4,1]
            if (pi[5,2] < 0.05) a$IndirimOrani <- a$IndirimOrani*pi[5,1]


            a$churn.prob<-a$HizmetSuresi3+a$SikayetSayisi+a$TeknikDestekTalebi+a$MobilDataKullanimi+a$IndirimOrani

            aa<-select(a,c(SUBSCRIPTION_ID,churn.prob,CHURN))

            aaa <-aa %>% mutate("Risk_level"=
                                    ifelse(between(churn.prob, -1.10,-0.60), "Very Low Risk",
                                           ifelse(between(churn.prob, -0.601,-0.20), "Low Risk",
                                                  ifelse(between(churn.prob, -0.201,-0.01), "Medium Risk",
                                                         ifelse(between(churn.prob,  0,0.20), "High Risk",
                                                                ifelse(between(churn.prob,  0.201,0.60), "Highest Risk", "NON"))))))

            aaaa.churnvar<-aaa %>% filter(CHURN==1)
            aaaa.churnyok<-aaa %>% filter(CHURN==0)


            adat.var<-count(aaaa.churnvar,Risk_level)
            adat.yok<-count(aaaa.churnyok,Risk_level)
            adat.yok$n2<-adat.yok$n
            adat1<-left_join(adat.var, adat.yok,by = c("Risk_level"))

            p <- plot_ly(adat1, x = ~Risk_level, y = ~n, type = 'bar', name = 'Churn Var') %>%
                add_trace(y = ~n2, name = 'Churn Yok') %>%
                layout(xaxis = list(title = "",
                                    categoryorder = "array",
                                    categoryarray = c("Very Low Risk","Low Risk",
                                                      "Medium Risk","High Risk","Highest Risk"),barmode = 'group'),yaxis = list(title = ""))
            pp<-p %>% config(displayModeBar = F)

            output$Display <- renderPlotly({pp})


        })#Closing observeEvent
    })# Closing observe


}


shinyApp(ui = ui, server = server)
Shiny applications not supported in static R Markdown documents
Created on 2019-11-20 by the reprex package (v0.3.0)